
The World Health Organization (WHO) reports that approximately 7 million people worldwide die each year as a result of exposure to air pollution. For context: this is roughly equal to the total combined death count from dementia, diabetes, road injuries, HIV/AIDS, suicide, and armed conflict (Our World in Data). Unsurprisingly, this health burden is distributed extremely unequally across the world. The following maps were obtained from the Global Burden of Disease (GBD) – Compare visualization tool.
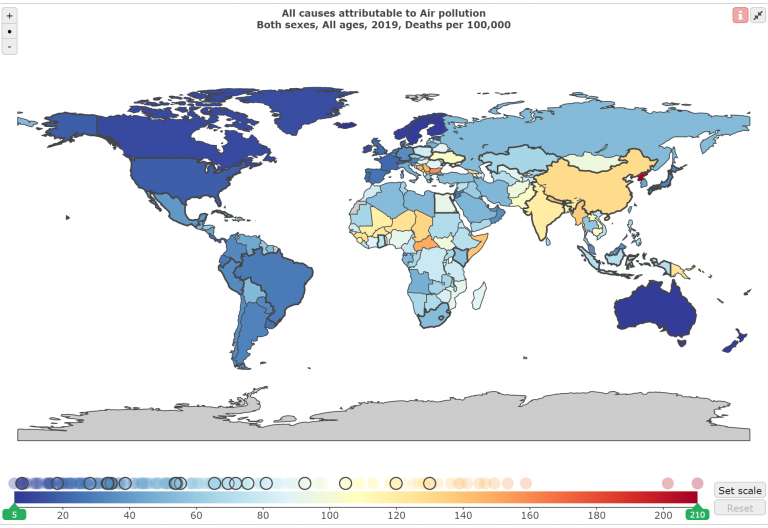
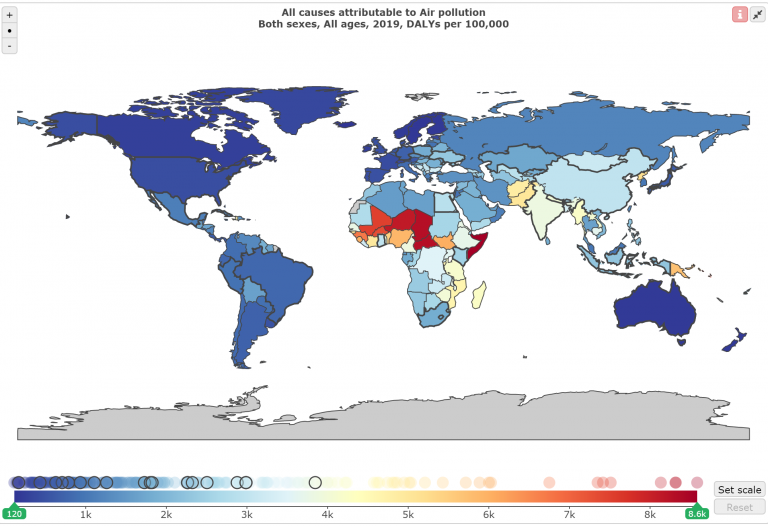
The map also looks quite different when we consider disability adjusted life years (DALYs) instead of deaths. DALYs account for the total reduction in length and quality of life attributable to an exposure. The DALYs map shows an even more unequal distribution of the health burden due to air pollution, indicating that while many deaths in lower-income countries are officially attributed to other causes, air pollution is a major contributing factor to overall morbidity (suffering from a health condition) in these countries. Also, even though the scaling on the DALYs map obscures some variability among higher- and middle-income countries, the WHO reports that 91% of the world’s population live in places where the air pollution exceeds WHO guidelines.
Of the previously-mentioned 7 million deaths, about 4.2 million are attributed to ambient (outdoor) air pollution and about 2.8 million are attributed to household (indoor) air pollution. Ambient air pollution is due to a combination of natural and anthropogenic sources. Natural sources include smoke from wildfires and particles from dust storms. Anthropogenic sources (which dwarf natural sources) include fuel combustion from vehicles, heat and power generation, industrial facilities, and waste processing / incineration. Indoor air pollution is mostly due to smoke from dirty cookstoves and fuel use, which also contributes to ambient air pollution (WHO).
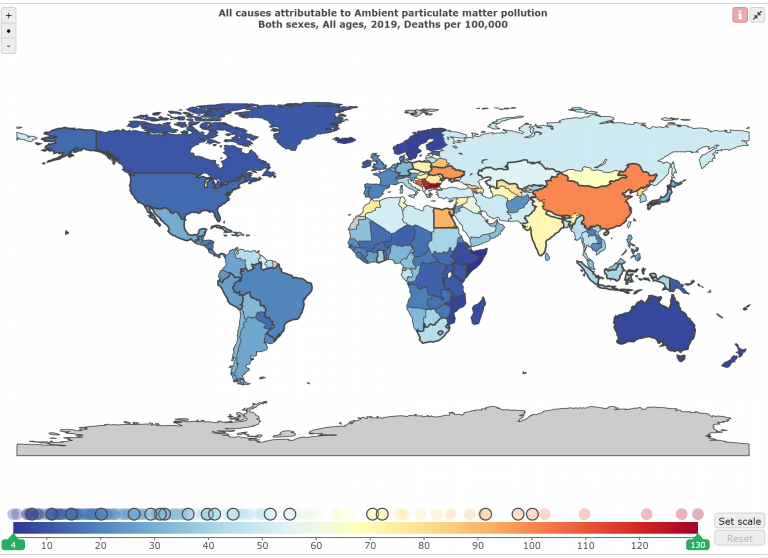
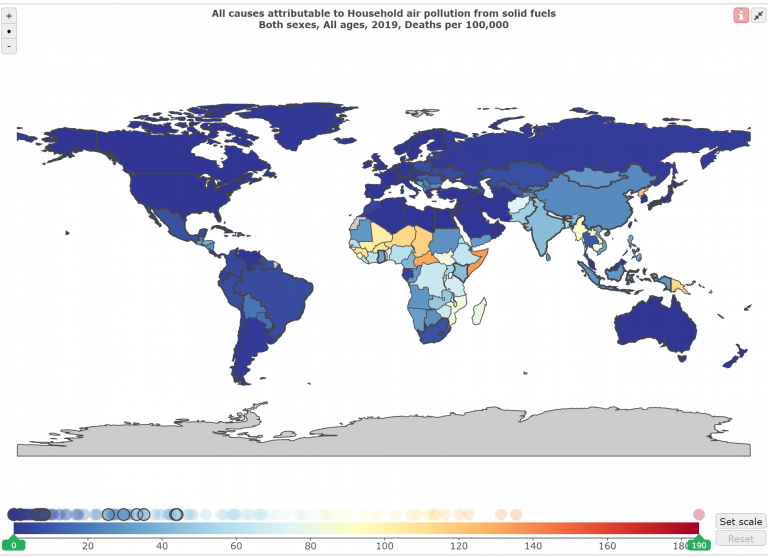
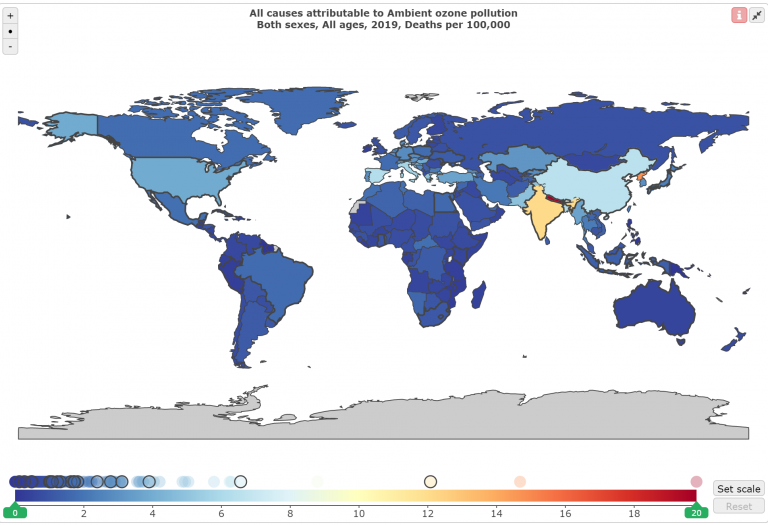
You may have noticed that the ambient air pollution plot specified “particulate matter pollution”. Two main kinds of air pollution that can have large health impacts are particulate matter (PM) and ground-level ozone. In contrast to the PM map, the world map of deaths attributable to ground-level ozone highlights countries with high and middle income levels. This is because ground-level ozone is created when chemicals emitted by machines or industrial processes react with sunlight (US EPA), so countries with more motorized transportation and manufacturing generate more of this pollutant.
Together with nitrogen dioxide and sulfur dioxide, PM and ground-level ozone are the air pollutants for which the strongest evidence of adverse health effects has been collected. Another phrase you might encounter is “criteria air pollutants”. In the US, the criteria air pollutants (these four plus carbon monoxide and lead) are regulated by the Clean Air Act, which requires the Environmental Protection Agency (EPA) to set National Ambient Air Quality Standards (NAAQS) for each pollutant.
The main biological mechanisms for how air pollution impacts health are oxidative stress and inflammation. Intuitively, respiratory health can be heavily impacted, because breathing takes air pollutants directly into our respiratory system. Many studies have shown that respiratory outcomes include asthma development, respiratory infections, and chronic loss of pulmonary function. Via inflammation, particles getting into the bloodstream, and direct and indirect effects on the nervous system, air pollution is also strongly associated with cardiovascular health impacts. These include arrhythmia, heart failure, and stroke, all three associations especially large for people with heart disease (US EPA: respiratory and cardiovascular impacts).
Growing evidence has also shown associations between early-life or prenatal air pollution exposures and adverse health outcomes in children, including low birth weight, high blood pressure, reduced lung function growth, reduced cognitive development, and neurobehavioral problems (National Institute of Environmental Health Sciences, NIEHS). In older adults, air pollution has also been associated with a higher chance of developing neurological disorders such as Alzheimer’s disease, Parkinson’s disease, and other dementias, as well as with a hastening of physical disabilities (NIEHS). Recent work has also linked air pollution and mental illness: a 2019 systematic review reported significant associations between PM and depression, anxiety, and suicide. Finally, air pollution has been associated with increased cancer incidence, including breast cancer, lung cancer, and leukemia (NIEHS).
Clearly, air pollution is a huge public health issue; air pollution epidemiology has been a cornerstone of environmental public health for decades. It is crucial that voters, policy makers, and scientists from other disciplines be aware of the health impacts of air pollution in order to make informed decisions in both their personal and professional lives. However, this discussion does not end there.
Challenges faced in air pollution epidemiology and policy-making (including insufficient data quantity and/or quality, disparities in exposure and health outcomes among different groups of people, and interdependence with climate change) are mirrored in other arenas of public health and echoed in other fields such as economics. The development of methods and tools by scientists, policy makers, and community members for the purposes of monitoring, analyzing, and managing air pollution and its health impacts represents larger progress in harnessing data for the social good and in aligning human quality of life with environmental sustainability.
In future blog posts, I will explain major concepts and challenges in data science applied to air pollution epidemiology, explore recent advances as well as directions for future work in this field, and discuss some societal implications of the science. As you read, I encourage you to keep in mind the bigger picture of what these ideas represent and to think about other applications.
***
More from Ellen Considine here.
BCPHR.org was designed by ComputerAlly.com.
Visit BCPHR‘s publisher, the Boston Congress of Public Health (BCPH).
Email [email protected] for more information.
Click below to make a tax-deductible donation supporting the educational initiatives of the Boston Congress of Public Health, publisher of BCPHR.![]()
© 2025-2026 Boston Congress of Public Health (BCPHR): An Academic, Peer-Reviewed Journal
All Boston Congress of Public Health (BCPH) branding and content, including logos, program and award names, and materials, are the property of BCPH and trademarked as such. BCPHR articles are published under Open Access license CC BY. All BCPHR branding falls under BCPH.
Use of BCPH content requires explicit, written permission.