Social Vulnerability and Pediatric Infectious Disease: COVID-19 as a Case Study in Massachusetts Towns

By Kaitlin Schroeder MPH, Kristina Thompson PhD, Manika Kosaraju MPH, Donald R. Miller ScD, Scott Troppy MPH, Alan C. Geller MPH, RN

Facebook
Twitter
LinkedIn

Citation

Schroeder K, Thompson K, Kosaraju M, Miller D, Troppy S, Geller A. Social vulnerability and pediatric infectious disease: COVID-19 as a case study in Massachusetts towns. HPHR. 2024;84. https://doi.org/10.54111/0001/FFFF02

Social Vulnerability and Pediatric Infectious Disease: COVID-19 as a Case Study in Massachusetts Towns​

Abstract

Introduction

The purpose of this research is to evaluate the relationship between town-level social vulnerability and pediatric COVID-19 cases during the 2021-2022 school year in all 351 Massachusetts towns.

Methods

This observational study used the census-based Social Vulnerability Index (SVI, our key independent variable) and ecological data for COVID-19 cases, PCR testing, and vaccinations at the town level. Multilevel mixed models were used to examine the relationship between SVI and pediatric COVID-19 case rates in two age groups.

Results

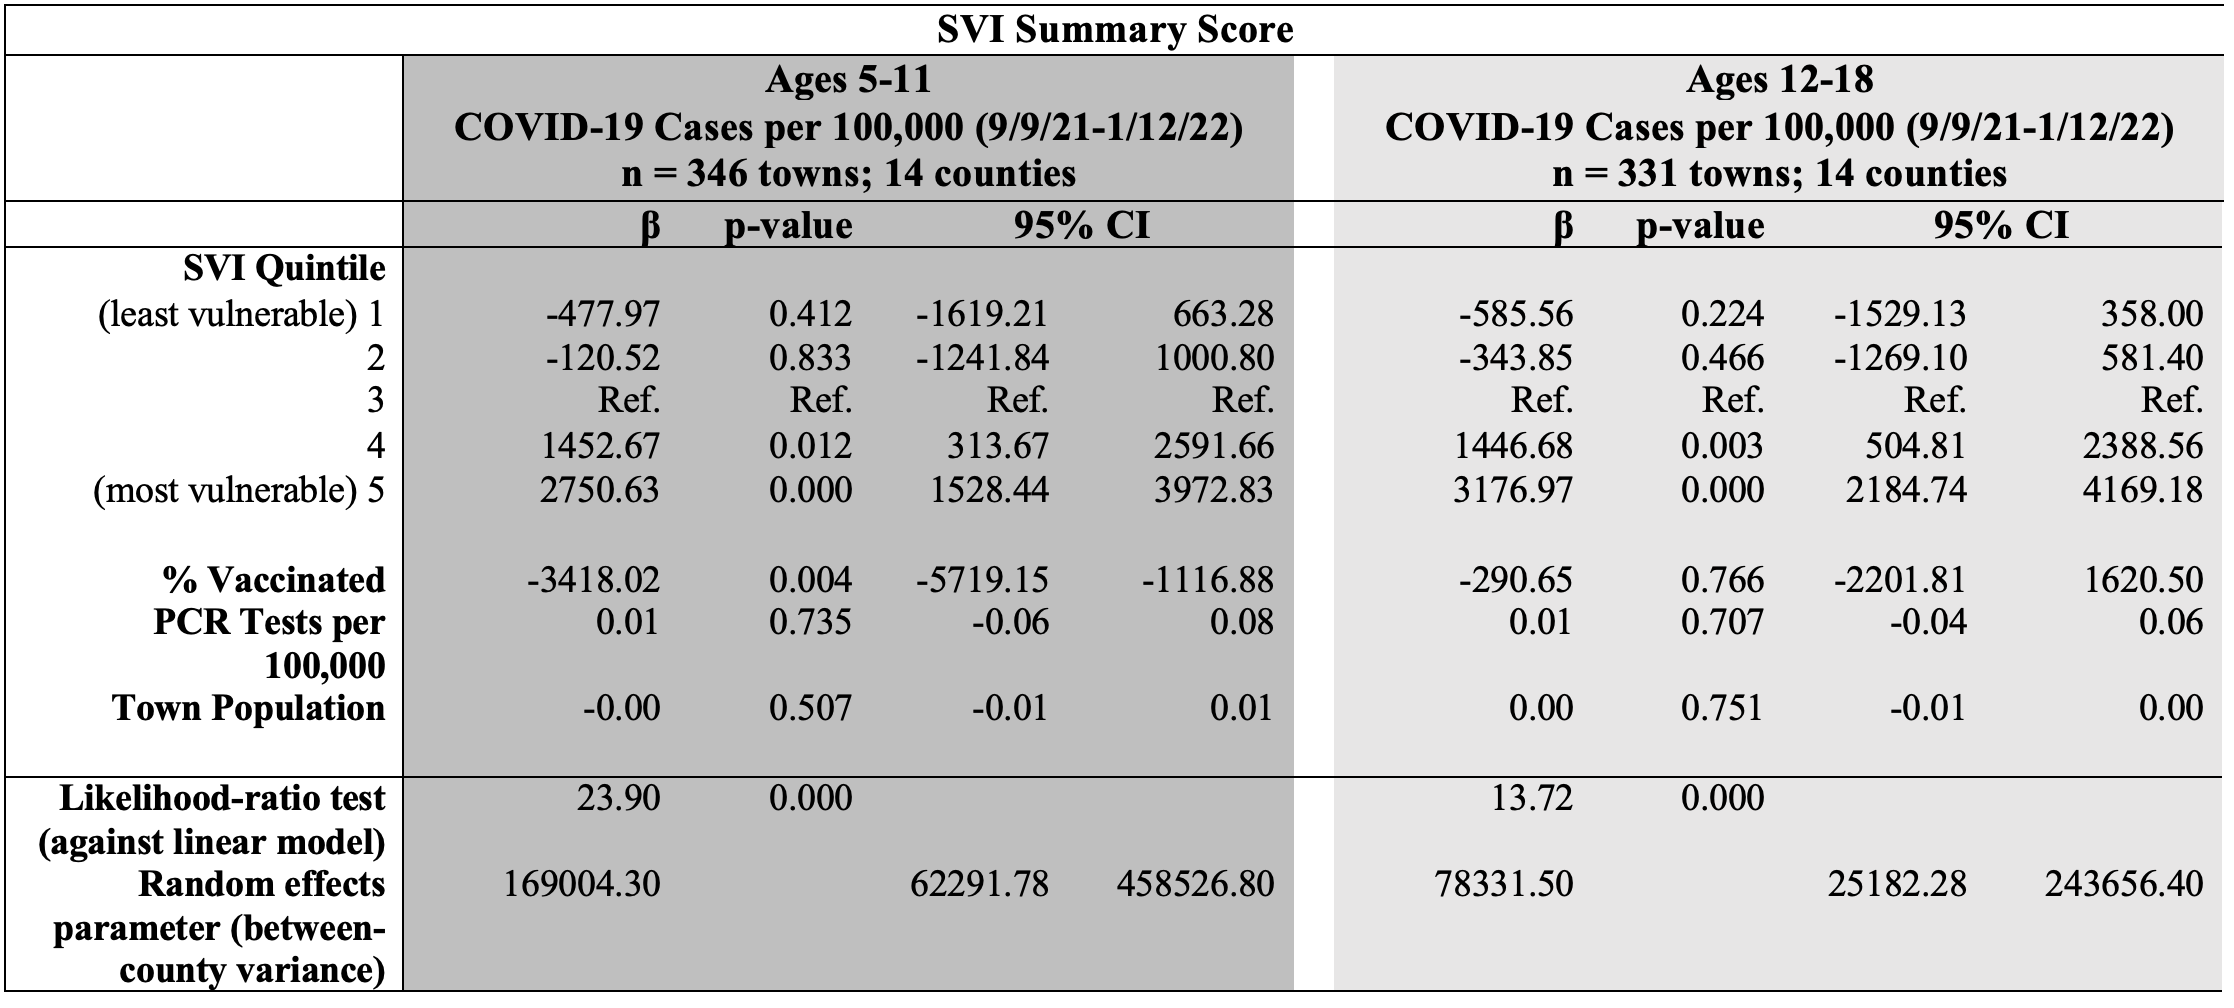
For children ages 5-11, living in the most socially vulnerable towns (SVI Quintile 5) was associated with an increase of 2,751 COVID-19 cases per 100,000, relative to the middle category (95% CI: 1,528 – 3,973). For children ages 12-18, residing in SVI Quintile 5 was associated with 3,177 additional COVID cases per 100,000 (95% CI: 2,185 – 4,169), and an increase was also observed for SVI Quintile 4. In both age groups, there was a positive trend in COVID-19 cases across social vulnerability quintiles.

Conclusion

Children from socially vulnerable towns experienced a greater burden of disease during the COVID-19 pandemic. Social vulnerability index data may aid public health officials and school health personnel in directing resources to mitigate harms for children in future infectious disease outbreaks.

Introduction

A socially vulnerable town may be less able to prevent human suffering and financial loss in the event of disaster.1 Social vulnerability is often defined by social conditions, including high poverty, a low percentage of vehicle access, and/or crowded households.1–3 In the case of an infectious disease outbreak, socially vulnerable towns may experience a higher burden of illness and require greater support in mitigation and recovery efforts. In the United States, this appears to have been the case during the COVID-19 pandemic. Between 2020 and 2021, county-level social vulnerability was associated with increased COVID-19 cases and deaths.4,5 There is limited research, however, as to whether children in socially vulnerable towns have been disproportionately affected by the COVID-19 pandemic. This is important to investigate, as the COVID-19 pandemic may have amplified existing forms of social and economic inequalities, and worsened children’s life chances.

Children may have been impacted by the COVID-19 pandemic in several ways. First, the disease itself has been a serious burden on children. Between March 2020 and May 2023, nearly 15.6 million children tested positive for COVID-19 in the United States.6 While most children experience less severe courses of the disease, COVID-19 was the eighth leading cause of death for children in 2022, due to pulmonary illness.7

Second, an estimated 216,617 U.S. children lost a parent or co-residing caregiver to COVID-19 as of May 2022.8 Non-White children were more than twice as likely as White children to suffer such a loss. Caregiver losses may have profound consequences on children’s mental health, educational attainment, and future employment.8

Third, it appears that COVID-19 had a serious impact on child learning. In Massachusetts, one of the only states to report COVID-19 infections on a municipal level, chronic absenteeism – defined as missing more than 10% of the 180 days in a school year – rose dramatically between 2019 and 2022: from 13% in 2019 to approximately 28% in 2022.9 COVID-19 infection was responsible for approximately 1.7 million missed school days in 2022.10 Further, average standardized testing scores administered to Massachusetts students in grades 3 through 8 were reported to have dropped by 20%.10

There is initial evidence that these learning losses have been disproportionately borne by children from more vulnerable towns. This was likely in part due to remote learning during periods with stay-at-home orders. By relying more heavily on parental involvement and technology, remote learning appears to have exacerbated socioeconomic status differences in learning outcomes.11 In this study, we examined the relationship between town-level social vulnerability and pediatric COVID-19 case rates. The study was conducted in the state of Massachusetts where, unlike many states where COVID-19 information is reported on the county level, case rates are reported on the more granular town level due to Home Rule provisions in the Commonwealth.12

Methods

Data and Variables

We tabulated cumulative COVID-19 case counts for all 351 Massachusetts towns for residents aged 5-11 years and 12-18 years and restricted our analysis to the study dates September 9, 2021 through January 12, 2022, encompassing the height of the Omicron wave in Massachusetts and nationwide. This corresponds with the beginning of the 2021-2022 school year and extends through the time when children returned from the Winter 2021 vacation. We completed case ascertainment as of January 12, 2022, corresponding to the time when rapid antigen testing became more widely utilized and thus making it more difficult to accurately track the burden of COVID-19 on children. We examined case rates rather than hospitalization or morality rates since these data were not available at the town level.

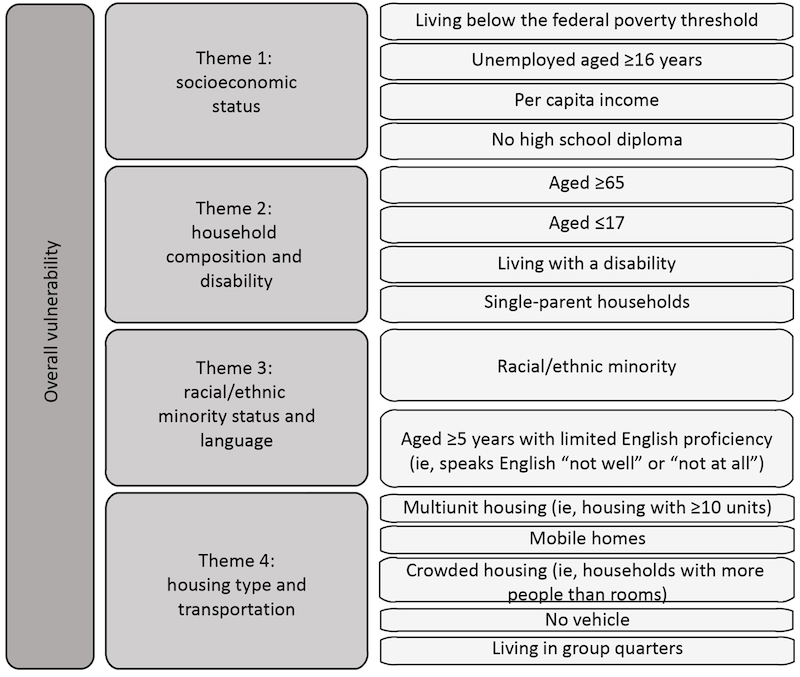
Our key independent variable was town-level social vulnerability, operationalized using the Centers for Disease Control and Prevention (CDC’s) 2018 Social Vulnerability Index (SVI).1 We use the term “town” to broadly refer to towns or cities. Towns were chosen as the geographic unit of analysis because local boards of health in Massachusetts operate primarily at the town level, and most children go to school and participate in social activities in their town of residency. SVI is a validated measure used to identify towns that may be particularly susceptible to devastation from events like natural disasters or infectious disease outbreaks.1,3 SVI is constructed by ranking 15 social factors across four themes: socioeconomic status, household composition & disability, minority status & language, and housing type & transportation (see Appendix I).2

The CDC tracks and publishes SVI at county and census tract levels. Our analysis draws upon the work of Troppy et al., which involved a transformation of county-level SVI to town-level SVI across all 351 towns to investigate the availability of COVID-19 testing in Massachusetts.13 Eleven of the 15 SVI indicators most relevant to COVID-19 were selected (based on a literature review) and used to create an overall SVI composite score as well as scores for each of the four themes.13,14 We classified towns into five quintiles with an estimated 70 towns per quintile of SVI (ranging from least vulnerable- SVI Quintile 1, to most vulnerable- SVI Quintile 5), for the composite score and for each of the four themes.

Outcomes and Covariates

Our main outcome variable was pediatric COVID-19 cases per 100,000. Age-specific case counts and population estimates were provided in aggregate form for towns by a data request process through the Massachusetts Department of Public Health (MDPH). These data were used to calculate case rates per 100,000 individuals in each age group. Each week, the MDPH published cumulative and weekly age-specific case counts for all 351 towns. MDPH case reports only included positive PCR tests.

We also included several covariates. Town-level vaccination rates for each age group were tabulated from publicly available MDPH reports. We defined vaccinated individuals as those who have received at least two doses of a Pfizer or Moderna mRNA vaccine or one dose of the Johnson & Johnson vaccine. Vaccine rates reported as “>95%” for a particular age group were recorded as 97.5% for the analysis. Vaccination rates included 19-year-olds in the 12-19 age group, while the case data included only those up to 18 years. When fewer than 30 doses were recorded for a particular age group and town, the vaccination rate for that age group was excluded from the dataset. This yielded 346 towns for the ages 5-11 years analysis and 331 towns available for the ages 12-18 years analysis. The town-level vaccination rate for residents ages 18+ was not included as a covariate due to collinearity with the pediatric vaccination rate.

We obtained PCR testing data from public MDPH reports, using the date range of 9/11/21-1/15/22 as the closest available match to our case data. Age group breakdowns were not available for testing data, so we incorporated them in the model as PCR tests per 100,000 for the overall town population.

Town population size was obtained through the SVI database, which uses estimates from the 2018 American Community Survey.2,15
Finally, we did not include race and ethnicity as covariates since they are already components of SVI Theme 3. Instead, we used American Community Survey estimates of seven categories of race/ethnicity for descriptive purposes.16

Data Analysis

Descriptive statistics were reported for case rates, vaccination rates, PCR testing rates, town population, and race and ethnicity for each quintile of SVI. Multilevel models were used to investigate the relationship between SVI composite score quintile and pediatric COVID-19 case rates. These models included random intercepts at the county level, to account for similarities among towns within the same counties. In all models, SVI Quintile 3 was the reference category. Unadjusted and adjusted regression models were performed and were stratified by age (5-11 years and 12-18 years). For the adjusted models, town-level covariates were added in a stepwise approach: % fully vaccinated, PCR tests per 100,000 town residents, and town population size.


To test for trend, we obtained Spearman’s rank correlation coefficients for each age group to ascertain the strength and direction of correlation between case rates and SVI Quintile in the 351 towns. Several additional analyses were performed to better understand the influence of different domains of social vulnerability. Multilevel models were used to examine the relationship between each of the SVI theme scores and COVID-19 cases in the two age groups. These results were in line with our main analyses.

Results

The results of the multilevel models, examining SVI’s relationship to COVID-19 cases, are reported in Table IV for both 5 to 11 and 12 to 18 year-olds. Among children ages 5-11, being in the fifth SVI quintile (the most socially vulnerable towns) was associated with an increase of 2,751 COVID-19 cases per 100,000 [95% CI: 1,528 – 3,973], relative to being in the third SVI quintile. Being in the fourth SVI quintile (with the second-most vulnerable towns) was also associated with higher case rates, relative to being in the third SVI quintile. Decreases in case rates were observed for children in the least socially vulnerable towns (SVI Quintiles 1 and 2) when compared with SVI Quintile 3, but the differences were not statistically significant. We observed a positive trend in case rates by SVI Quintile, with a Spearman correlation coefficient of 0.39 (p < 0.001).

SVI’s Relationship to COVID-19 Cases, Ages 5-11

The results of the multilevel models, examining SVI’s relationship to COVID-19 cases, are reported in Table IV for both 5 to 11 and 12 to 18 year-olds. Among children ages 5-11, being in the fifth SVI quintile (the most socially vulnerable towns) was associated with an increase of 2,751 COVID-19 cases per 100,000 [95% CI: 1,528 – 3,973], relative to being in the third SVI quintile. Being in the fourth SVI quintile (with the second-most vulnerable towns) was also associated with higher case rates, relative to being in the third SVI quintile. Decreases in case rates were observed for children in the least socially vulnerable towns (SVI Quintiles 1 and 2) when compared with SVI Quintile 3, but the differences were not statistically significant. We observed a positive trend in case rates by SVI Quintile, with a Spearman correlation coefficient of 0.39 (p < 0.001).

SVI’s Relationship to COVID-19 Cases, Ages 12-18

Among 12 to 18 year-olds, being in the fourth and fifth SVI quintile was associated with an increase of 1,447 [95% CI: 505 – 2,389] and 3,177 [95% CI: 2,185 – 4169] COVID-19 cases per 100,000 children, respectively, relative to being in the third SVI quintile (Table IV). The rates were lower but not statistically different for those residing in towns in SVI Quintiles 1 and 2 relative to SVI Quintile 3. The Spearman correlation coefficient for SVI Quintile and case rates in this age group was 0.47, indicating a moderate, positive correlation (p < 0.001).

Individual SVI Themes’ Relationships to COVID-19 Cases

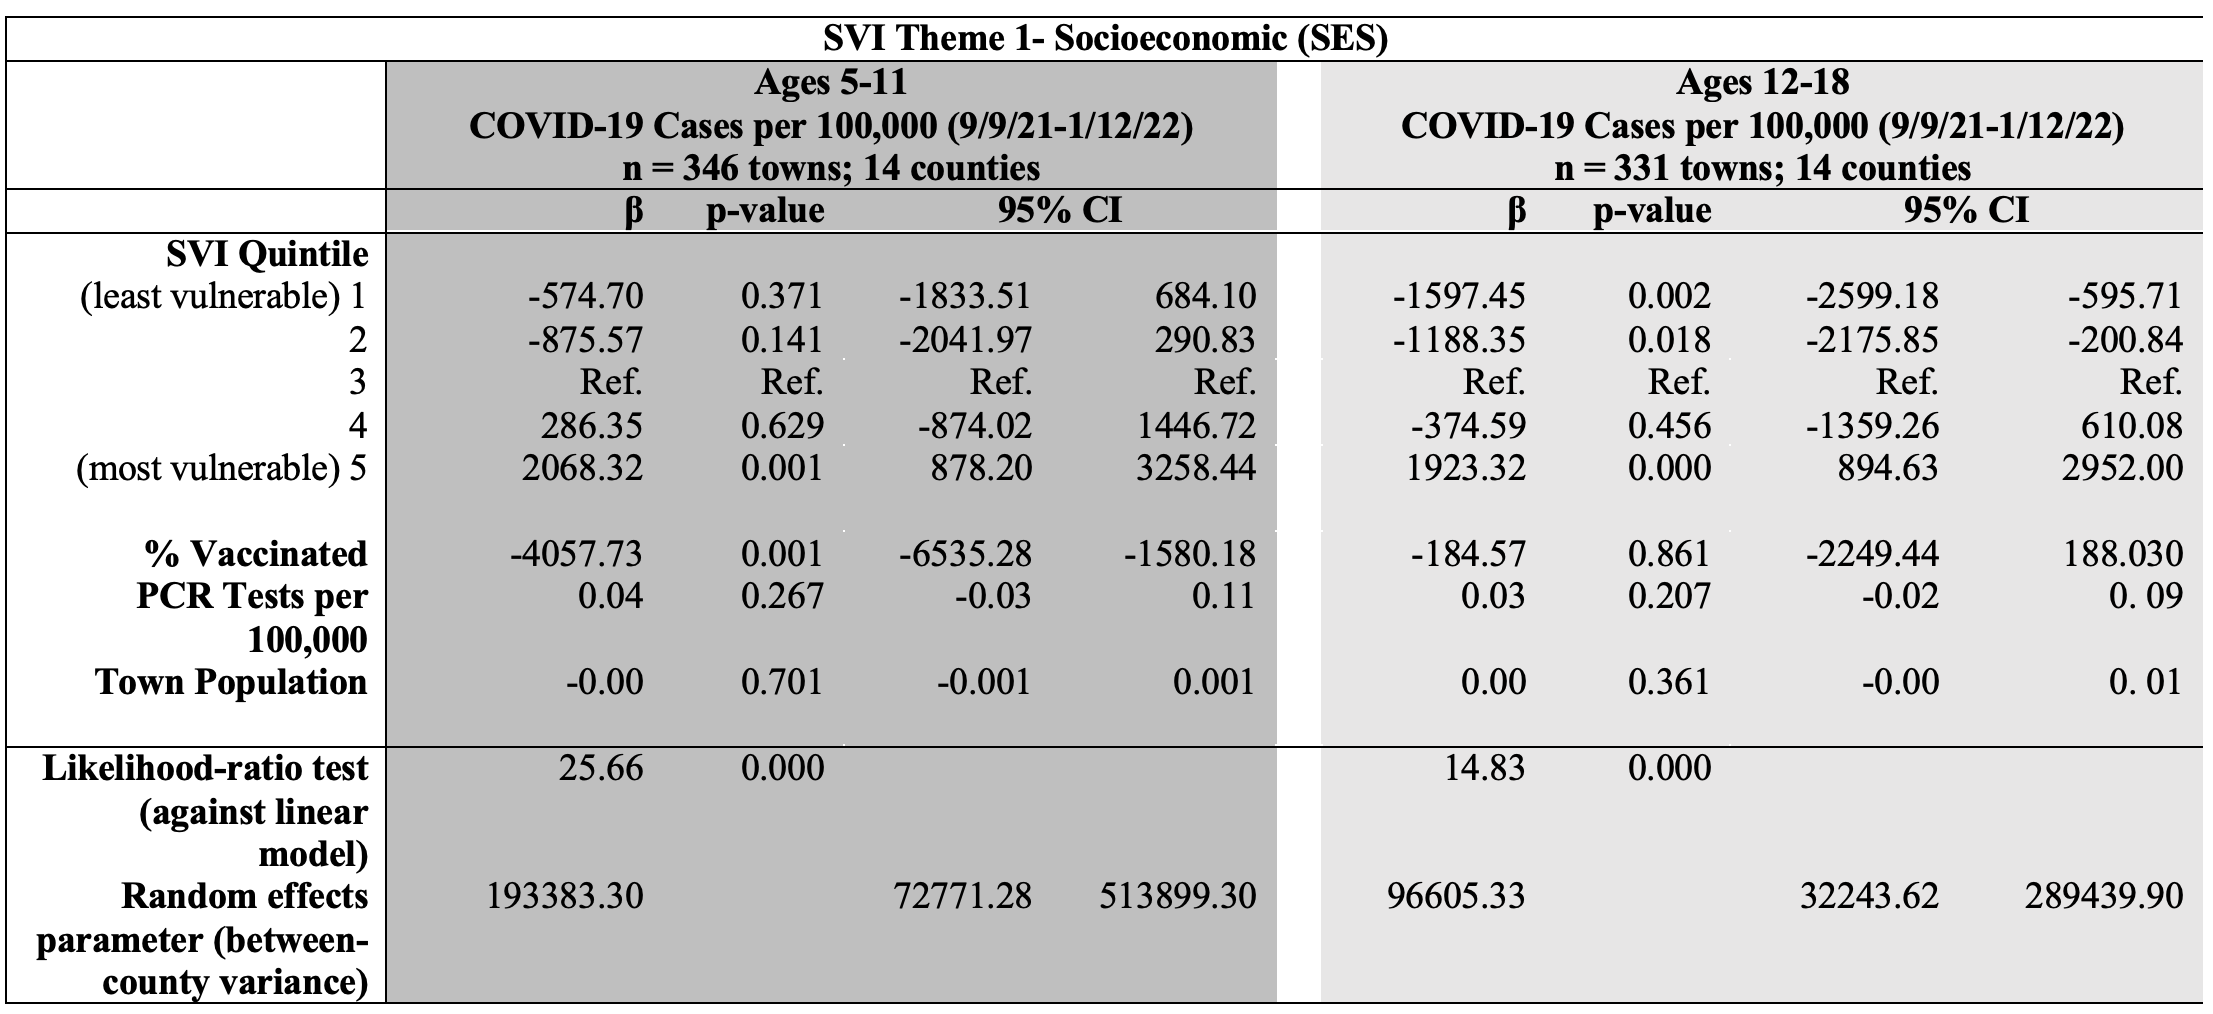
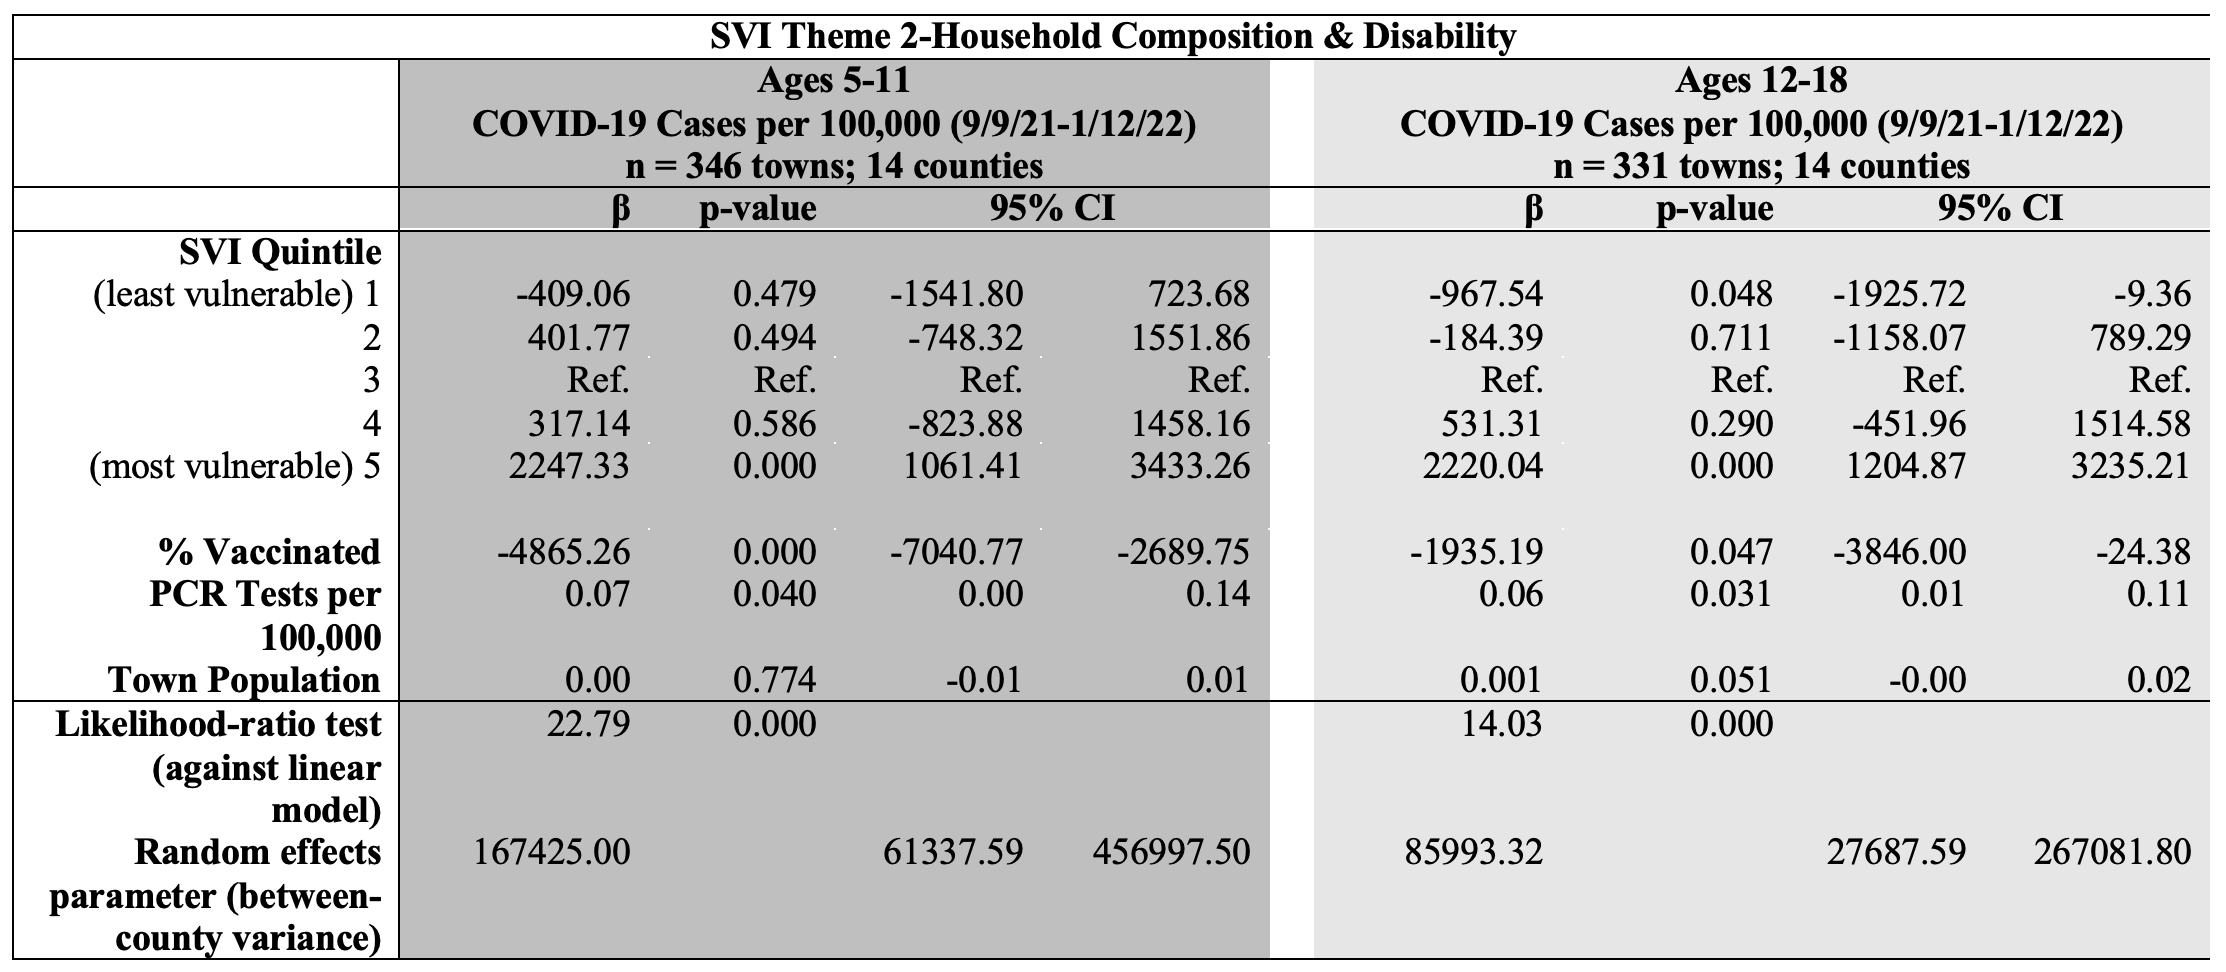
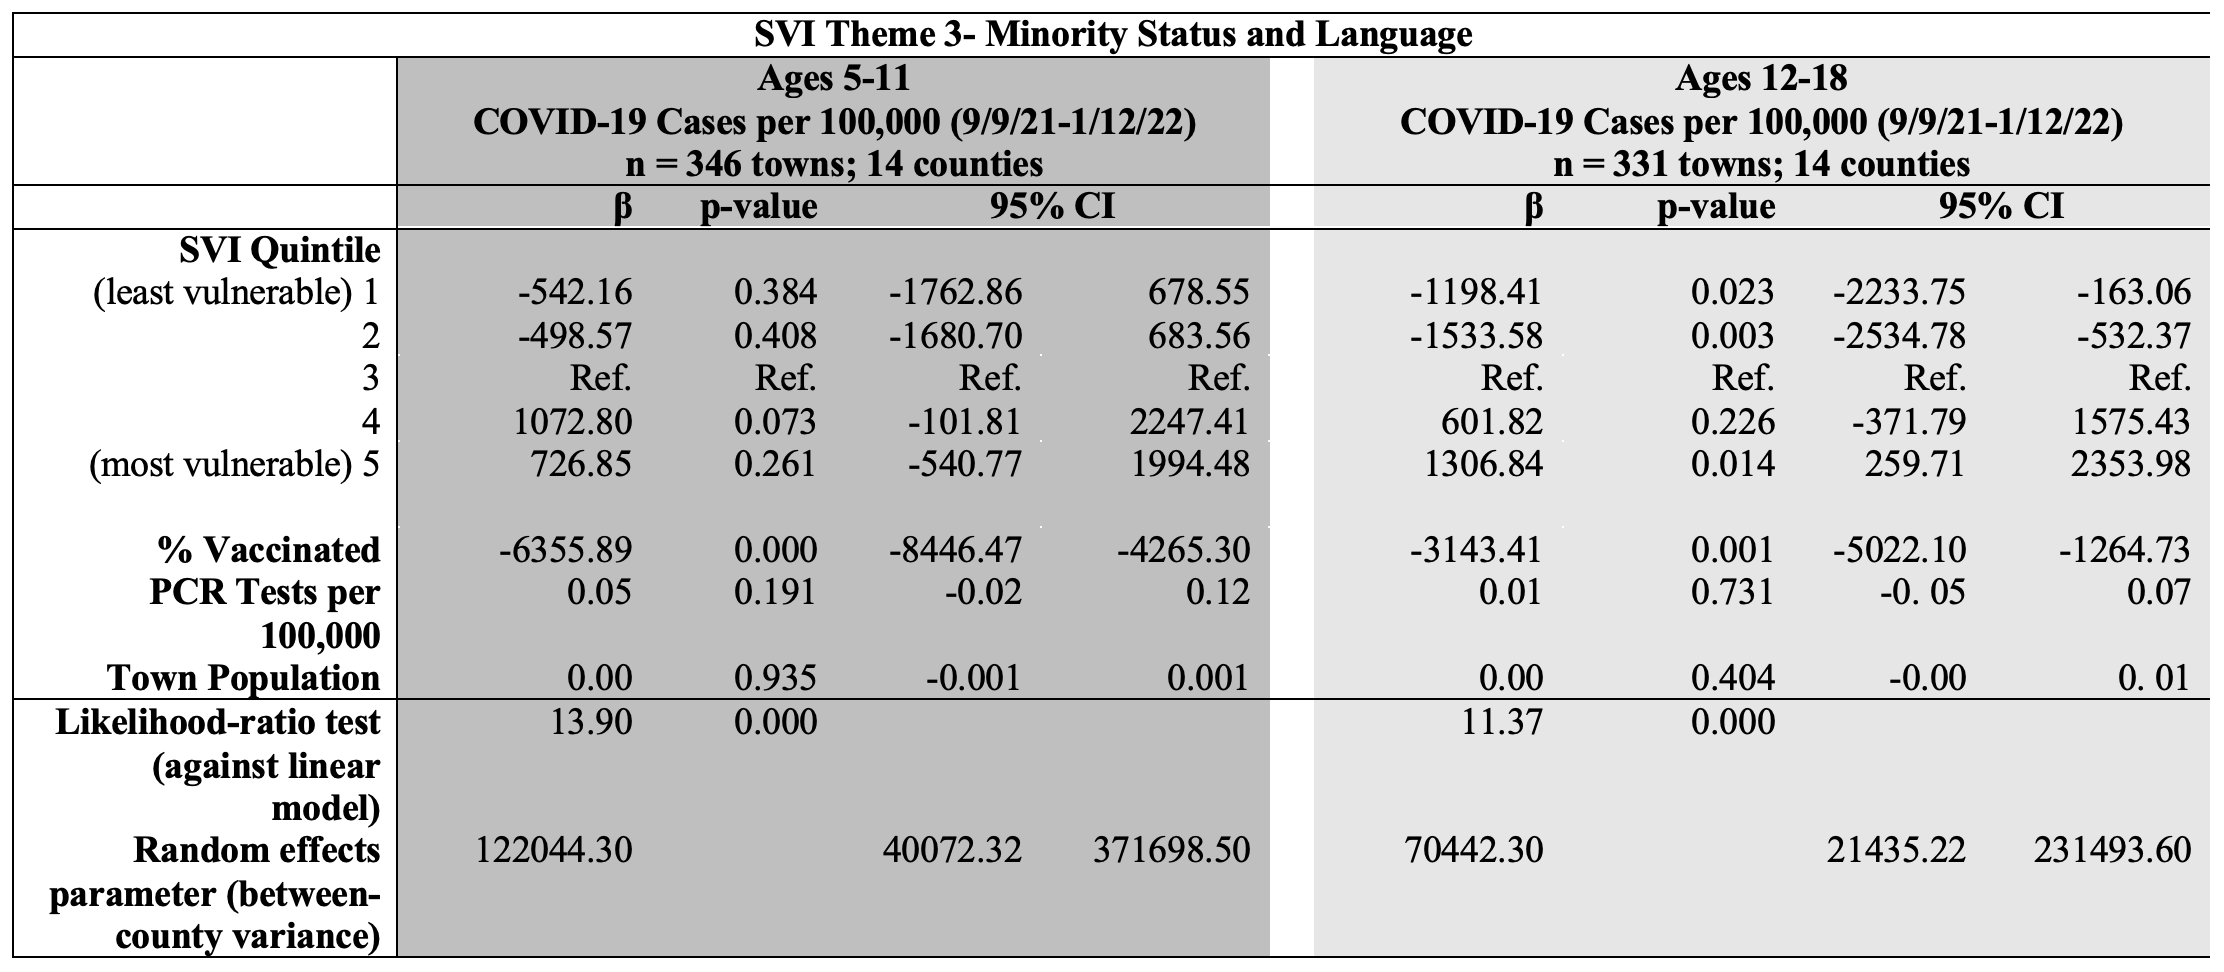
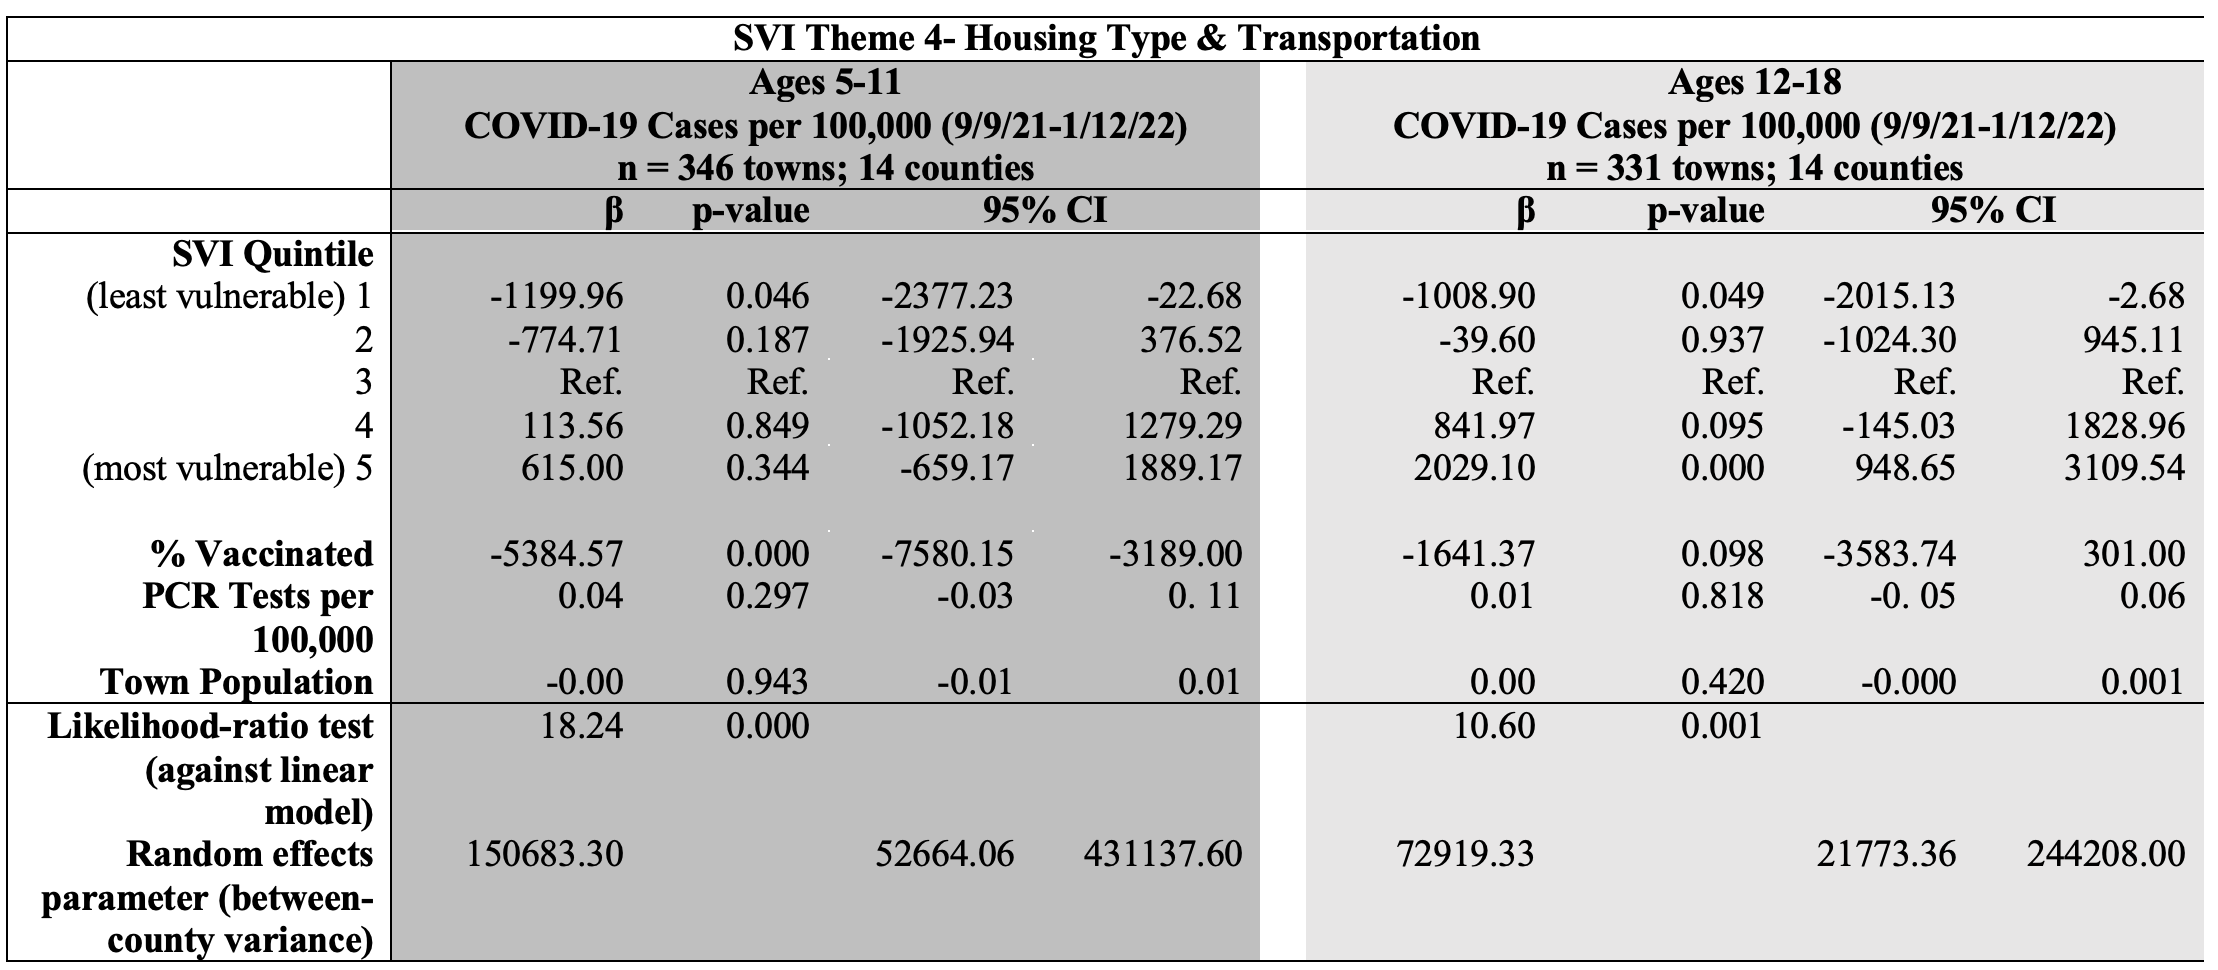
The individual SVI themes’ relationships to COVID-19 case rates are reported in Appendix II. For the age group 5-11, the themes Socioeconomic Status (SES) and Household Composition were associated with a greater number of cases for children living in the fifth SVI quintile relative to being in the third SVI quintile. For the age group 12-18, the SVI themes SES, Household Composition, Minority Status, and Housing Type & Transportation were associated with a greater number of cases for children living in SVI Quintile 5, relative to being in the third SVI quintile.

Further Research and Recommendations

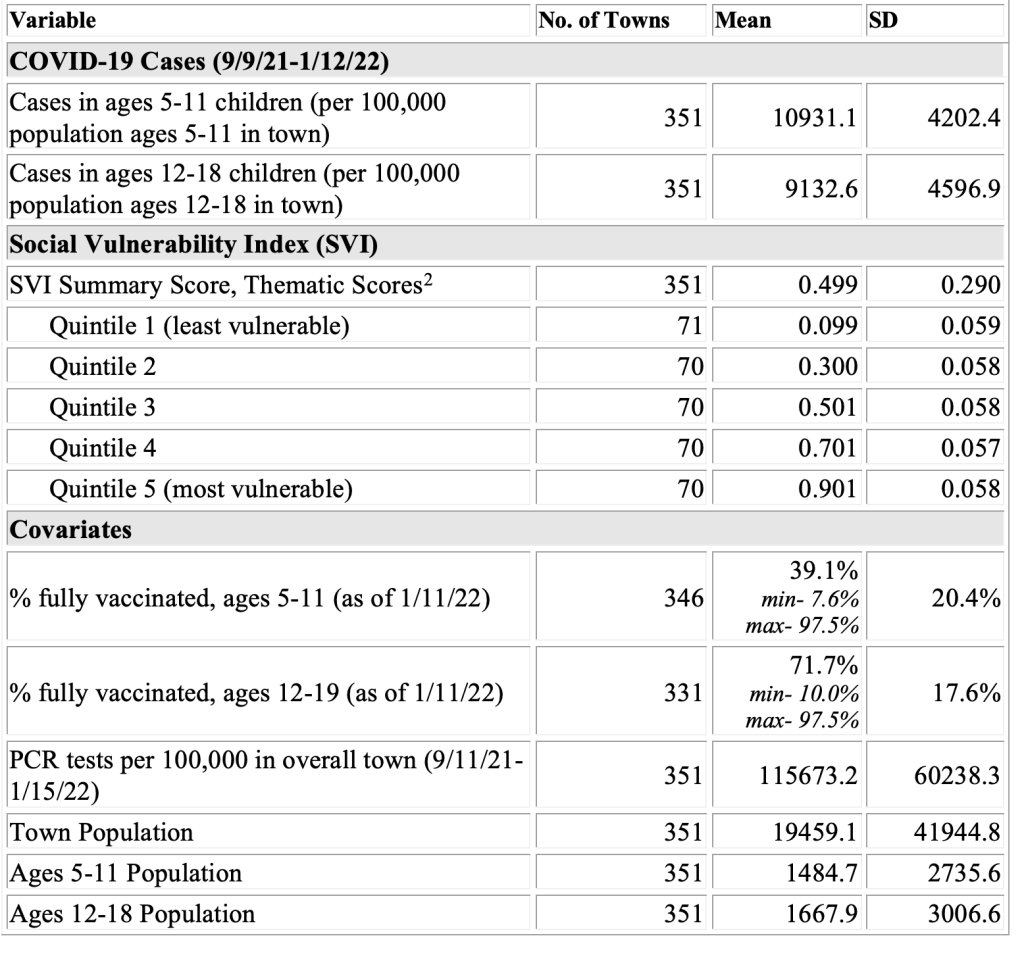
During the 2021-22 school year, COVID-19 had a disproportionate effect on children in the United States. In Massachusetts, through the end of the school year, more than 30% of children tested positive for COVID-19 via PCR testing alone.17–19 The case rates we report in Table I were similar to national pediatric case rates published by the American Academy of Pediatrics during our study period: 7032.1 cases per 100,000 children in September 2021 to 12,558.6 cases per 100,000 in January 2022.6

Strikingly, in Massachusetts, more than 58,000 school staff, or 41%, also were infected. With children and staff averaging five missed school days, conservatively, for the 2021-22 academic year, we estimate the loss of 1.5 million class days for students, 1 million work days for their parents, and more than a quarter of a million lost work days for educators and staff.13

There are scant data, however, as to whether COVID-19 disproportionately affected specific vulnerable towns where children and their families live. In the one of the only other studies on town-specific pediatric COVID-19 infection rates, Bao et al. found a disproportionate impact of pediatric COVID-19 infection on zip codes of lower socioeconomic status in Miami-Dade and Broward counties and among increased racial/ethnic minority populations.20 Using a geospatial analysis, researchers in Houston found differential rates of COVID-19 but did not specifically examine rates in children.21 In the absence of information on the relationship between social vulnerability and COVID infections, we used a well-established metric, the Social Vulnerability Index, developed by the CDC, to measure the effect of COVID-19 on Massachusetts children in two age groups, at the town level.22–25 SVI is divided into 5 quintiles with SVI Quintile 5 representing the most vulnerable towns in Massachusetts, often comprising the state’s most highly populated cities.

In our analysis, we evaluated the relationship between rates of COVID-19 diagnosed in school-age children during the height of the Omicron wave and the SVI of the towns in which they lived. For our youngest age group, ages 5 to 11 years, living in one of the 70 most socially vulnerable towns was associated with an increase of 2,751 COVID-19 cases per 100,000 relative to the middle reference category. For children ages 12 to 18, residing in a town in SVI Quintile 5 was associated with an increase of 3,177 COVID-19 cases per 100,000 relative to the reference category.

It is important to track the pediatric burden of infection at the most geographically discrete level—in Massachusetts, this is the town level—as it is likely related to the same disproportionate burden of more severe outcomes in children with higher social vulnerability.26 The Massachusetts Department of Public Health (MDPH) collected from local boards of health the number of PCR-determined cases, tests performed, and vaccines administered, and it reported these weekly to the public. Having up-to-date information on all three modifiable outcomes helped enable MDPH and community organizations to target high-risk towns where transmission was likely widespread. An earlier study in Los Angeles County found that child and adult index cases both efficiently transmitted SARS-CoV-2 within households and concluded that children play important roles as index cases.27 Similarly, in a separate study, household transmission of SARS-CoV-2 from children and adult primary cases to household members was frequent.28

The findings speak to profound disparities in rates of COVID-19 infection for children in high SVI towns. Many of the structural obstacles, such as minimal access to vaccines, the dearth of multi-lingual vaccine ambassadors, and/or lack of workplace health and safety measures remain in place. By March 2023, only 58% of Massachusetts children ages 6 months to 19 years had received their primary COVID-19 vaccination series.29 Clearly, outreach to promote COVID-19 vaccine uptake and other mitigation strategies fell short.

Going forward, the CDC and state and local public health departments must work with leaders in vulnerable towns to expand vaccine coverage. These strategies could include the use of vaccine ambassadors, mobile vaccination programs, and school-based programs, all of which have been used in Massachusetts and elsewhere. For example, a large-scale effort in the Mission District, San Francisco resulted in 20,000 new vaccinations over a 16-week period.30 This was implemented in three phases: (1) community mobilization pre-vaccination, (2) the day of vaccination with a low-barrier, client-centered vaccination site, and (3) post-vaccination leveraging social networks to increase trust among remaining vaccine-hesitant community members.

Wastewater surveillance programs must be maintained in towns and considered in periods of high transmission at the level of school districts. Passive environmental surveillance can detect the presence of COVID-19 cases in non-residential community school settings with a high degree of accuracy.31 Finally, we must make healthy buildings a priority.

The information presented herein speaks to the need for remaining vigilant in this period after the end of COVID-19 federal public health guidelines that occurred in May 2023.32 Curtailing easier access to both testing and vaccinations and imposing a cost structure for our highest-risk towns and uninsured/underinsured individuals will likely have deleterious effects on our youngest children. There are limitations to this study. Our analysis was limited to one state, and we did not have information on all potential confounding factors, such as family size. More generally, this analysis was based on town-level data for two age groups only, and we did not have the actual measures for each child in the towns, as this information is not available from the MDPH. Thus, in our ecologic analysis, there may have been some error in estimating the effects of measures on COVID-19 infection, testing, and vaccination rates. Finally, MDPH does not report hospitalization data at the town level. Strengths included utilization of statewide outcome data, use of the SVI measure transformed to the town level, and reporting at the height of the Omicron wave.

Conclusion

Obtaining town-specific data with a special focus on children living in vulnerable communities is of great importance. We need to plan for current and future outbreaks of other infectious diseases such as the flu and RSV that profoundly affected school-age children this past winter. Of equal importance, infectious disease experts are concerned about yet unforeseen infectious diseases, with epidemic potential, that must be planned for at the national, state, and local levels. Our findings suggested that COVID-19 was a greater burden on children in the most socially vulnerable towns and underscore the critical need to protect these children from future public health threats.
Tables

Table I. Sample Characteristics

Table 1

Towns are grouped into 5 equal-sized categories of SVI. Summary statistics are identical for the summary score and scores for Themes 1-4. Theme 1: Socioeconomic; Theme 2: Household Composition & Disability; Theme 3: Minority Status & Language; Theme 4: Housing Type & Transportation.
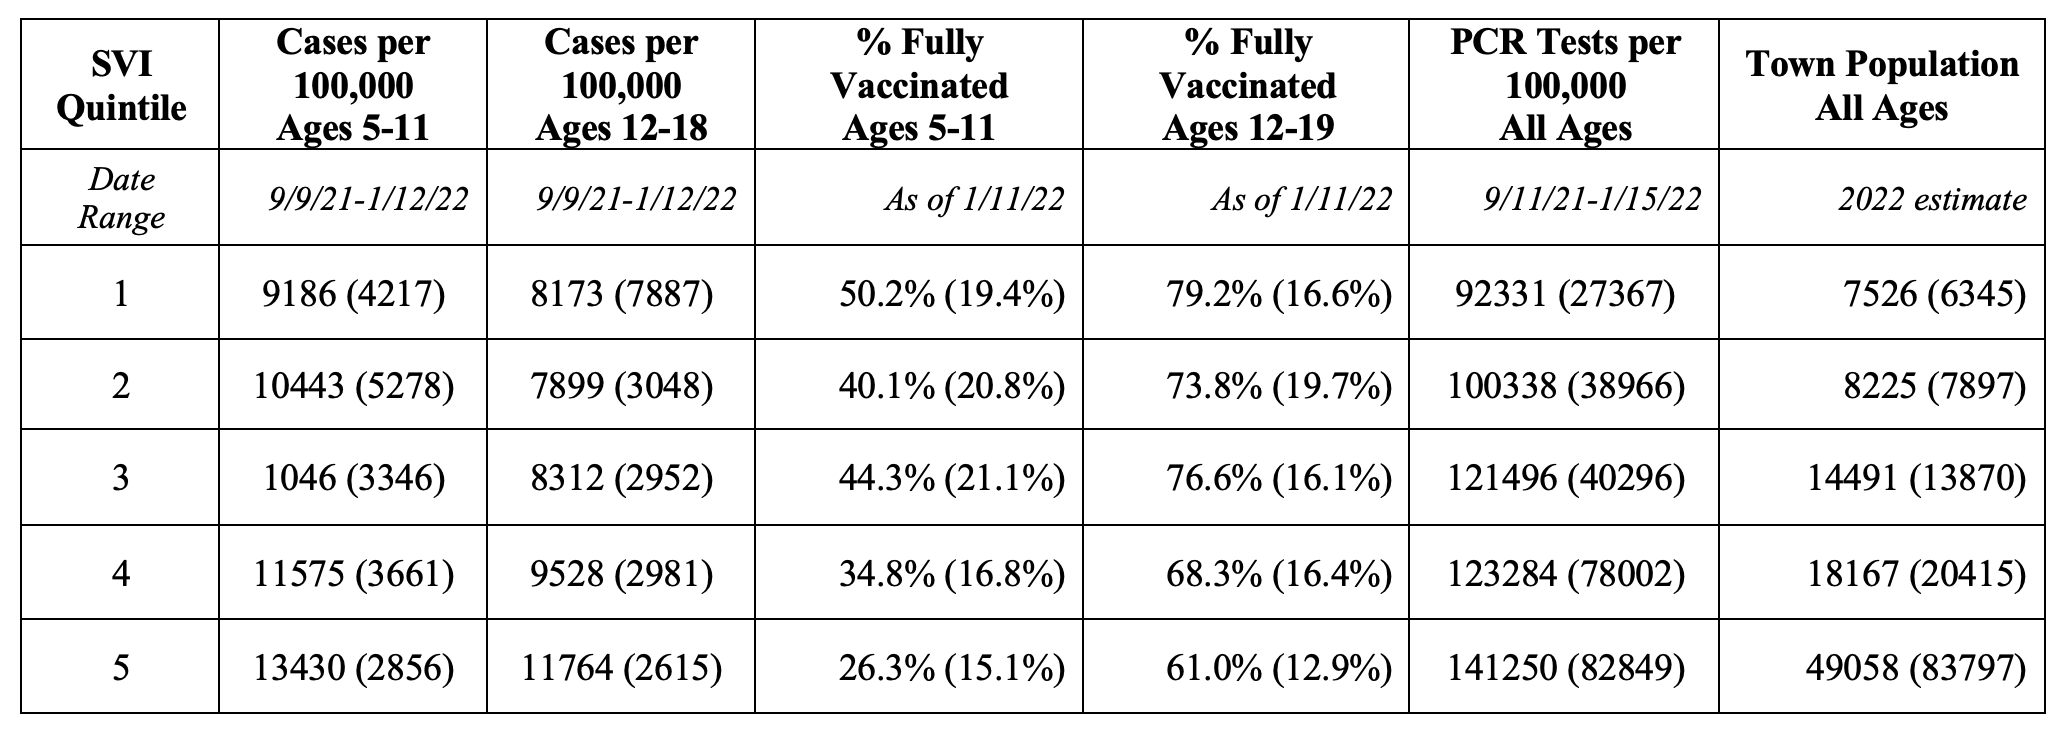
Table II. Average COVID-19 Cases, Vaccinations, PCR Tests, and Population Size by SVI Quintile

Table II. Average COVID-19 Cases, Vaccinations, PCR Tests, and Population Size by SVI Quintile

Standard deviation listed in parentheses.

Table III. Average COVID-19 Cases, Vaccinations, PCR Tests, and Population Size by SVI Quintile

Table III. Average COVID-19 Cases, Vaccinations, PCR Tests, and Population Size by SVI Quintile​

Table IV. Table IV. SVI Summary Score vs. Pediatric COVID-19 Cases per 100,000, Adjusted Model

Table IV. SVI Summary Score vs. Pediatric COVID-19 Cases per 100,000, Adjusted Model

Appendix I. Social Vulnerability Index Components and Themes

Modified and adapted from Agency for Toxic Substances and Disease Registry.1 Used with permission from Scott Troppy, MPH.10

Appendix II. SVI Theme Scores vs. Pediatric COVID-19 Cases per 100,000, Adjusted Model

SVI Theme 1- Socioeconomic (SES
SVI Theme 2-Household Composition & Disability
SVI Theme 3-Minority Status and Language

Disclosure Statement

The authors of this study have no relevant financial disclosures or conflicts of interest.

References

  1. Centers for Disease Control and Prevention. CDC/ATSDR SVI Fact Sheet. Accessed March 23, 2023. https://www.atsdr.cdc.gov/placeandhealth/svi/fact_sheet/fact_sheet.html
  2. Centers for Disease Control and Prevention. CDC SVI Documentation 2018. CDC Agency for Toxic Substances and Disease Registry. Published January 31, 2020. Accessed March 23, 2023. https://www.atsdr.cdc.gov/placeandhealth/svi/documentation/SVI_documentation_2018.html
  3. Flanagan BE, Gregory EW, Hallisey EJ, Heitgerd JL, Lewis B. A Social Vulnerability Index for Disaster Management. J Homel Secur Emerg Manag. 2011;8(1). doi:10.2202/1547-7355.1792
  4. Khazanchi R, Beiter ER, Gondi S, Beckman AL, Bilinski A, Ganguli I. County-Level Association of Social Vulnerability with COVID-19 Cases and Deaths in the USA. J Gen Intern Med. 2020;35(9):2784-2787. doi:10.1007/S11606-020-05882-3/FIGURES/1
  5. Magesh S, John D, Li WT, et al. Disparities in COVID-19 Outcomes by Race, Ethnicity, and Socioeconomic Status: A Systematic Review and Meta-analysis. JAMA Netw Open. 2021;4(11):e2134147-e2134147. doi:10.1001/JAMANETWORKOPEN.2021.34147
  6. American Academy of Pediatrics. Children and COVID-19: State-Level Data Report. AAP. Published March 16, 2023. Accessed March 19, 2024. https://www.aap.org/en/pages/2019-novel-coronavirus-covid-19-infections/children-and-covid-19-state-level-data-report/
  7. Flaxman S, Whittaker C, Semenova E, et al. Assessment of COVID-19 as the Underlying Cause of Death Among Children and Young People Aged 0 to 19 Years in the US. JAMA Netw Open. 2023;6(1):e2253590-e2253590. doi:10.1001/JAMANETWORKOPEN.2022.53590
  8. Treglia D, Cutuli JJ, Arasteh K, Bridgeland J. Parental and Other Caregiver Loss Due to COVID-19 in the United States: Prevalence by Race, State, Relationship, and Child Age. J Community Health. 2023;48(3):390. doi:10.1007/S10900-022-01160-X
  9. Department of Elementary and Secondary Education. Student Attendance and Chronic Absenteeism. DOE. Published April 11, 2022. Accessed March 23, 2023. https://www.doe.mass.edu/sfs/attendance/
  10. Haynes C, Drysdale S. Chronic absenteeism a growing problem in Massachusetts schools. Yahoo News. https://news.yahoo.com/chronic-absenteeism-growing-problem-massachusetts-122243363.html?guccounter=1&guce_referrer=aHR0cHM6Ly93d3cuZ29vZ2xlLmNvbS8&guce_referrer_sig=AQAAAHTO5AtQR44b3dx-rSDXe1yW-tkhtGQKEbaGdcOyNiTSy_oqkHi4sG-iK5tByllXlPmm_DY_x6Ok1__ui8yowdUK3qNacGpP-eLWNziWARxCagB8Gl7CZxd0EQF4frDtI5VyDFc_VNIfZ2jH6GP-6s9jVD2Ikrytl1xlqRSoMxyh. Published October 26, 2022. Accessed March 23, 2023.
  11. Goudeau S, Sanrey C, Stanczak A, Manstead A, Darnon C. Why lockdown and distance learning during the COVID-19 pandemic are likely to increase the social class achievement gap. Nature Human Behaviour 2021 5:10. 2021;5(10):1273-1281. doi:10.1038/s41562-021-01212-7
  12. Department of Revenue Massachusetts. What is Home Rule? Division of Local Services. Published January 2020. Accessed March 31, 2024. https://www.mass.gov/doc/home-rule/download
  13. Troppy S, Wilt GE, Whiteman A, et al. Geographic Associations Between Social Factors and SARS-CoV-2 Testing Early in the COVID-19 Pandemic, February–June 2020, Massachusetts. https://doi.org/101177/00333549211036750. 2021;136(6):765-773. doi:10.1177/00333549211036750
  14. Hallisey E, Tai E, Berens A, et al. Transforming geographic scale: A comparison of combined population and areal weighting to other interpolation methods. Int J Health Geogr. 2017;16(1):1-16. doi:10.1186/S12942-017-0102-Z/FIGURES/7
  15. United States Census Bureau. 2014-2018 ACS 5-year Estimates. United States Census Bureau. Accessed May 31, 2023. https://www.census.gov/programs-surveys/acs/technical-documentation/table-and-geography-changes/2018/5-year.html
  16. United States Census Bureau. Data Profiles | American Community Survey. United States Census Bureau. Published 2019. Accessed May 31, 2023. https://www.census.gov/acs/www/data/data-tables-and-tools/data-profiles/2019/
  17. To keep schools open during COVID, Governor Baker must make them safer – The Boston Globe. Boston Globe. https://www.bostonglobe.com/2022/01/10/opinion/keep-schools-open-during-covid-governor-baker-must-make-them-safer/. Published January 10, 2022. Accessed May 4, 2023.
  18. State has a lot more to do to keep students and educators safe from COVID – The Boston Globe. The Boston Globe. https://www.bostonglobe.com/2022/06/06/opinion/state-has-lot-more-do-keep-students-educators-safe-covid/. Published June 6, 2022. Accessed May 4, 2023.
  19. Is Massachusetts prepared for COVID-19 safety in the classroom? – The Boston Globe. The Boston Globe. https://www.bostonglobe.com/2022/08/30/opinion/is-massachusetts-prepared-covid-19-safety-classroom/. Published August 30, 2022. Accessed May 4, 2023.
  20. Bao E, Easwaran L, Maurer M, Gwynn L. Mapping of Pediatric COVID-19 Cases in Miami-Dade and Broward Counties: an Analysis of Sociodemographic Disparities. J Racial Ethn Health Disparities. Published online 2022:1. doi:10.1007/S40615-022-01362-Y
  21. Oluyomi AO, Gunter SM, Leining LM, Murray KO, Amos C. COVID-19 Community Incidence and Associated Neighborhood-Level Characteristics in Houston, Texas, USA. Int J Environ Res Public Health. 2021;18(4):1-16. doi:10.3390/IJERPH18041495
  22. Al Rifai M, Jain V, Khan SU, et al. Social vulnerability and COVID-19: An analysis of CDC data. Prog Cardiovasc Dis. 2022;73:91. doi:10.1016/J.PCAD.2021.09.006
  23. Texas Health and Human Services. Impact of COVID-19 on Vulnerable Populations in Texas.; 2022. Accessed March 23, 2023. https://www.hhs.texas.gov/sites/default/files/documents/redesigned-texas-county-level-vulnerability-covid-19-measures-dashboard-notes.pdf
  24. Dasgupta S, Bowen VB, Leidner A, et al. Association Between Social Vulnerability and a County’s Risk for Becoming a COVID-19 Hotspot — United States, June 1–July 25, 2020. MMWR Morb Mortal Wkly Rep. 2020;69(42):1535-1541. doi:10.15585/MMWR.MM6942A3
  25. Barry V, Dasgupta S, Weller DL, et al. Patterns in COVID-19 Vaccination Coverage, by Social Vulnerability and Urbanicity — United States, December 14, 2020–May 1, 2021. Morbidity and Mortality Weekly Report. 2021;70(22):818. doi:10.15585/MMWR.MM7022E1
  26. CDC. COVID-NET Interactive Dashboard. Published 2023. Accessed November 13, 2023. https://www.cdc.gov/coronavirus/2019-ncov/covidnetdashboard/de/powerbi/dashboard.html
  27. Tanaka ML, Marentes Ruiz CJ, Malhotra S, et al. SARS-CoV-2 Transmission Dynamics in Households With Children, Los Angeles, California. Front Pediatr. 2022;9. doi:10.3389/FPED.2021.752993
  28. Waltenburg MA, Whaley MJ, Chancey RJ, et al. Household Transmission and Symptomology of Severe Acute Respiratory Syndrome Coronavirus 2 Alpha Variant among Children-California and Colorado, 2021. J Pediatr. 2022;247:29-37.e7. doi:10.1016/J.JPEDS.2022.04.032
  29. Massachusetts Department of Public Health. Weekly COVID-19 Vaccination Report.; 2023. Accessed July 18, 2023. https://www.mass.gov/doc/weekly-covid-19-vaccination-report-march-15-2023/download
  30. Marquez C, Kerkhoff AD, Naso J, et al. A multi-component, community-based strategy to facilitate COVID-19 vaccine uptake among Latinx populations: From theory to practice. PLoS One. 2021;16(9). doi:10.1371/JOURNAL.PONE.0257111
  31. Fielding-Miller R, Karthikeyan S, Gaines T, et al. Safer at school early alert: an observational study of wastewater and surface monitoring to detect COVID-19 in elementary schools. The Lancet Regional Health – Americas. 2023;19:100449. doi:10.1016/J.LANA.2023.100449
  32. End of the Federal COVID-19 Public Health Emergency (PHE) Declaration | CDC. Centers for Disease Prevention and Control. Published May 23, 2023. Accessed May 4, 2023. https://www.cdc.gov/coronavirus/2019-ncov/your-health/end-of-phe.html

About the Author

Kaitlin Schroeder, MPH

Kaitlin Schroeder is a recent graduate of the Harvard T.H. Chan School of Public Health MPH program, where she studied social determinants of health in disease areas ranging from cancer to COVID-19. She currently works as a project manager in the field of oncology diagnostics.

Kristina Thompson, PhD

Kristina Thompson is an Assistant Professor in the Health and Society chair group of Wageningen University & Research, the Netherlands. She is a health demographer and quantitatively studies the social determinants of health. She completed her PhD in the Health Economics group of the Vrije Universiteit Amsterdam.

Manika Kosaraju, MPH

Manika completed her Master in Public Health at Harvard T.H. Chan as part of the Social and Behavioral Sciences Department in 2022. Manika has since gone on to work as a Director of Population Health, working with underserved geriatric populations to expand access to mental health and substance use interventions in primary care settings. Manika’s interests in research include health equity, health literacy, and social determinants of health.

Donald R. Miller, ScD

Dr. Donald R. Miller completed his Doctor of Science in Nutrition and Epidemiology at the Harvard School of Public Health. He currently serves as Research Professor at the University of Massachusetts and as Senior Epidemiologist with the VA Medication Safety Center and, until recently, the Center for Health Outcomes and Implementation Research. His current research and publications focus on population health, emerging epidemics, safety and effectiveness of therapies, and evaluation of patients’ experiences in health care.

Scott Troppy, MPH

Scott Troppy is a Surviellance Epidemiologist at the Massaschusetts Department of Public Health. He has interests in spatial and geographic research. He also works with infectious disease surveillance data for the Commonwealth of Massachusetts. He has a Masters in Public Health from Boston University.

Alan Geller, RN, MPH

Alan Geller is a Senior Lecturer in the Department of Social and Behavioral Sciences at the Harvard TH Chan School of Public Health. He has a long-standing interest in cancer prevention, early detection of cancer, and a myriad of issues related to children.