
Jones E. Public health prevention recommendations & pediatric surgery trauma case fatality trends by gender and age among pediatric pattients -≤1-9 years old in the United States 2012-2016. HPHR. 2024. 85. https://doi.org/10.54111/0001/GGGG6
Due to the lack of studies examining trauma-related injury and fatality trends and their implications on pediatric populations, this study aimed to address the gap in research and to identify the magnitude and the impact of unintentional injuries by exploring trends in trauma case fatalities among children in the United States from 2012 to 2016.
The study uses data from the National Trauma Data Bank (NTDB), which is an online database with data collected from trauma hospitals within the United States. Joinpoint regression models were used to calculate Annual Percentage Change (APC) and Average Annual Percentage Change (AAPC) as an indicator of trends.
The highest upward trends occurred in males with an average annual increase of 15.1% (AAPC, 15.1%, 95% CI, 7.1% to 26.5%), 6-year-olds with an average annual increase of 36.3% (AAPC, 36.3%, 95% CI, 18.5% to 83.0%), and 9-year-olds with an average annual increase of 36.4% (AAPC, 36.4%, 95% CI, 19.8% to 72.5%). Males (59.5%) and children ≤1 years old (20.9%) had higher percentages of trauma case fatalities.
This study identified an overall increase in trauma-related fatalities in all ages and genders. However, the trends did vary. Based on the findings, there needs to be more effort towards improving access to care, EMS response times, and socioeconomic factors attributing to poor supervision of children in families.
By addressing these issues, children in the United States will have improved physical and mental health outcomes. It would also reduce trauma case fatality trends in children.
Trauma-case fatalities and injuries in children are major health issues. Trauma-related injuries are the leading cause of death in children ages 1-17 years old.1 Generally, males and children less than 1 years old have a higher prevalence of trauma-related injuries and fatalities than females and any other young age group.1 Trauma-related injury and fatality distributions and patterns highlight major disparities based on sex and age.2 In 2019, there were about 20 deaths per day due to trauma-related injuries among children and teens ages 0-19 years old in the United States.
Globally, various epidemiological studies have shown a decreasing trend in trauma-related injuries and fatalities in recent years. However, the trends in trauma-related injuries and fatalities in United States are increasing. 3-4 Examining trends in trauma-related injuries and fatalities based on gender, and age are important and serve as a tool to bring awareness to the risk of injury and mortality for pediatric patients. Examining trends and assessing preventive measures in pediatric trauma related fatalities can also prevent injuries among children, who have an increased risk of injury and death. Despite the importance of the topic, few studies have examined trends in pediatric patients between the ages of ≤1 to 9 years old. The majority of the studies associated with trauma related injuries focus on adults with few of the studies outlining strategies to reduce injury. To address the gap in research, this study explored trends in the annual percentage change, and average annual percentage change in age adjusted trauma case fatality rates among children ≤1 to 9 years old from 2012 to 2016.
Data was exported from the National Trauma Data Bank (NTDB). The database contains surveillance data from the United States. Both the calculation of standard error in SAS Academics Studio and the preparation of MS Excel/ text files were used to create mortality models and trends in Joinpoint Regression software. Stratification was used to separate the sample into subgroups (gender, age groups).
Age-adjusted rates, and frequencies were extracted from NTDB. Standard error was calculated using SAS Studio.5 The Annual Percentage Change (APC) and Average Annual Percentage (AAPC) of mortality rates in various subgroups were calculated using U.S. Surveillance, Epidemiology, and End Results (SEER) Joinpoint regression program version 5.0.6 Joinpoint regression describes trends and significant changes in trends.
Based on the Bayesian information criterion, the Empirical Quantile Method was used to identify the significant best fit line for trend 1 and trend 2.7 P-value was not calculated based on the method. However, each model tested for significance and listed the results for significance. Confidence intervals were calculated for APC and AAPC.
Annual percentage change (APC) and average annual percentage change (AAPC) are statistical tools used in Joinpoint regression, which is used for assessing statistical trends. Annual percentage change (APC) is used to depict the change within a segment of the years of the study. The average annual percentage change (AAPC) is used to depict the change within the total years of the study. A significant APC and/or AAPC means that there is a valid change in the trend that is being evaluated. APC and AAPC were selected as a statistical approach for this study because Joinpoint regression is a more thorough means of identifying trends using reliable models.
Annual Percentage Change (APC)
APC assumes the change at a constant percentage of the rate of the previous year to predict outcomes. Therefore, the following regression model is used to estimate the APC for a series of data:

where is the natural log of the rate in year “y”.
The APC from year “y” to year “y+1”

Average Annual Percentage Change (AAPC)
The AAPC is a weighted average of the slope coefficients of the underlying Joinpoint regression model with the weights equal to the length of each segment over the interval. If we denote bi as the slope coefficient for the ith segment with i indexing the segments in the desired range of years, and wi as the length of each segment in the range of years, then:

There are 3 main methods for time trend analysis. These methods are regression analysis, Mann-Kendall test, and APC/AAPC. For this study, APC/AAPC was selected because of the type of dataset that was available for the study. Both regression analysis and Man Kendall test did not align with the format of the dataset. (Figure 1)
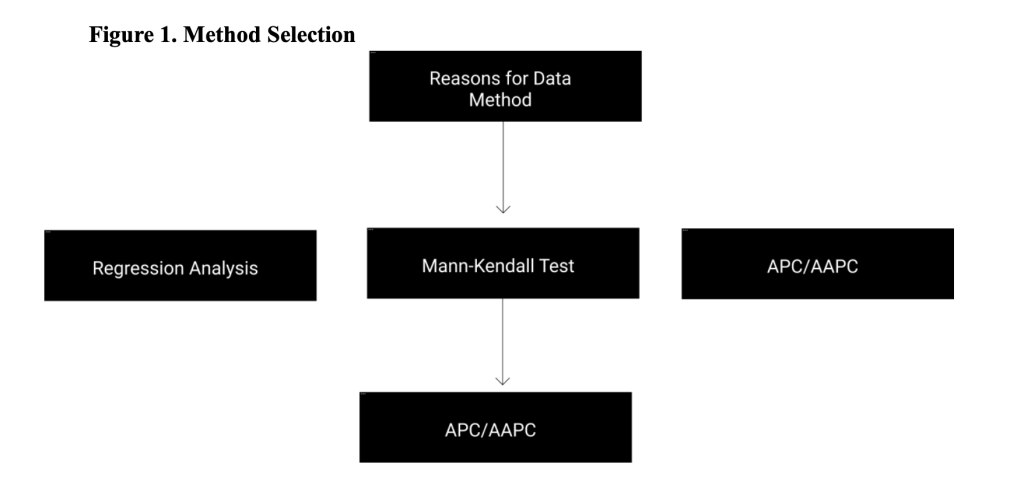
Table 1. Number of Trauma Cases, 2012-2016
Variables | Total Number | % | Deaths | % |
Gender | N=315,678a |
| N=5,115a |
|
Female | 139,493 | 44.2 | 2,064 | 40.4 |
Male | 176,185 | 55.8 | 3,031 | 59.3 |
|
|
|
|
|
Age Group |
|
|
|
|
≤ 1 year old | 46,837 | 14.8 | 1,065 | 20.9 |
1 year old | 35,478 | 11.2 | 776 | 15.2 |
2 years old | 33,761 | 10.7 | 615 | 12.1 |
3 years old | 30,730 | 9.7 | 507 | 10 |
4 years old | 29,936 | 9.5 | 426 | 8.4 |
5 years old | 32,008 | 10.1 | 370 | 7.3 |
6 years old | 30,896 | 9.8 | 390 | 7.7 |
7 years old | 27,815 | 8.8 | 339 | 6.7 |
8 years old | 25,017 | 7.9 | 314 | 6.2 |
9 years old | 23,200 | 7.3 | 293 | 5.8 |
Table 1 shows the number and percentage of trauma cases by gender, and age. Note: a Total number of deaths reported;
Table 2. Mechanism of Injury, 2012-2016
Variables | Total Numbera,b (N= 239,944) | Fall | *MVT | Struck by, Against | Transport, Other | Firearm | Cut/Pierce |
Age Group |
|
|
|
|
|
|
|
≤ 1 year old | 30,096 | 25,447 | 2,254 | 1,835 | 208 | 161 | 191 |
1 year old | 21,561 | 15,523 | 2,945 | 2,202 | 261 | 128 | 502 |
2 year old | 25,509 | 17,527 | 3,805 | 2,786 | 581 | 212 | 598 |
3 year old | 24,307 | 15,839 | 4,303 | 2,475 | 806 | 257 | 627 |
4 year old | 24,261 | 15,838 | 4,407 | 2,126 | 1,046 | 227 | 617 |
5 year old | 26,747 | 18,098 | 4,500 | 2,092 | 1,274 | 176 | 607 |
6 year old | 25,864 | 16,867 | 4,746 | 2,098 | 1,466 | 149 | 538 |
7 year old | 22,906 | 13,838 | 4,795 | 2,015 | 1,586 | 178 | 494 |
8 year old | 20,076 | 11,041 | 4,574 | 2,119 | 1,648 | 204 | 490 |
9 year old | 18,617 | 9,417 | 4,480 | 2,258 | 1,776 | 203 | 483 |
Table 2 shows the number of mechanisms of injury by age. Note: a Total number of cases reported; bTotal number by age varies based on data collection.*MVT stands for motor vehicle traffic.
Table 3. Trends in Trauma Case Fatality, 2012-2016
Characteristic | No. of cases(age-adjusted rates) | AAPC (95% CI) | Trend Segment 1 (95% CI) | ||
| 2012 | 2016 | 2012-2016 | Years | APC |
Gender |
|
|
|
|
|
Male | 467(1.3) | 839 (2.3) | 15.1 (7.1 to 26.5) | 2012-2016 | 15.1 (7.1 to 26.5) |
Female | 368(1.5) | 522(2.0) | 7.1 (-0.91 to 17.2) | 2012-2016 | 7.1(-0.91 to 17.2) |
|
|
|
|
|
|
Age Group(yrs) |
|
|
|
|
|
≤ 1 year old | 188(2.0) | 203(2.2) | 2.5(-8.5 to 14.9) | 2012-2016 | 2.5(-8.5 to 14.9) |
1 year old | 155(2.1) | 154(2.2) | 0.06(-6.9 to 7.1) | 2012-2016 | 0.06(-6.9 to 7.1) |
2 years old | 107(1.5) | 143(2.2) | 8.1(-0.7 to 18.6) | 2012-2016 | 8.1(-0.7 to 18.6) |
3 years old | 96(1.5) | 138(2.4) | 14.3(2.5 to 31.8) | 2012-2016 | 14.3(2.5 to 31.8) |
4 years old | 73(1.2) | 105(1.9) | 10.6(-2.2 to 28.7 | 2012-2016 | 10.6(-2.2 to 28.7) |
5 years old | 47(0.79) | 132(2.1) | 32.3(13.0 to 80.5) | 2012-2016 | 32.3(13.0 to 80.5) |
6 years old | 47(0.82) | 148(2.4) | 36.3(18.5 to 83.0) | 2012-2016 | 36.3(18.5 to 83.0) |
7 years old | 42(0.81) | 106(1.8) | 18.5(5.9 to 37.7) | 2012-2016 | 18.5(5.9 to 37.7) |
8 years old | 48(0.99) | 116(2.3) | 27.8(13.0 to 59.0) | 2012-2016 | 27.8(13.0 to 59.0) |
9 years old | 32(0.69) | 116(2.4) | 36.3(19.8 to 72.5) | 2012-2016 | 36.3(19.8 to 72.5) |
Table 4. Major Findings
Gender | Age Group | Mechanism of Injury |
Males have a higher number of trauma case fatalities, a higher rate of trauma case fatalities, and a higher and upward trend of trauma case fatalities than females. | £1 year olds have a higher percentage of trauma case fatality, and 6 and 9 year olds have a higher and upward trend of trauma care fatality. | Majority of injuries(66%) are caused by falls in children ages £1 to 9 years olds. |
Between 2012 to 2016, the United States had a total of 5,115 deaths from trauma cases. Majority of the cases occurred in males (59.3%), and the ≤ 1 year old age group (20.9%) (Table 1). 66.4% of the cases were caused by falls. (Table 2).
Overall, the most significant findings associated with gender were that males have a higher number of trauma case fatalities, a higher rate of trauma case fatalities, and a higher and upward trend of trauma case fatalities than females. These findings signify the presence of gender disparities and the higher risk of trauma case fatalities in males. (Table 4)
From 2012 to 2016, the age-adjusted trauma case fatality rate among males increased by 76.9% (1.3 deaths per 100,000 to 2.3 deaths per 100,000), with an average annual increase of 15.1% (AAPC, 15.1%, 95% CI, 7.1% to 26.5%). The age-adjusted trauma case fatality rate among females increased by 33.3% (1.5 deaths per 100,000 to 2.0 deaths per 100,000), with an average annual increase of 7.1% (AAPC, 7.1%, 95% CI, -0.91% to 17.2%). (Table 3)
The trends in males consisted of 1 segment: a significant APC of 15.1% (95% CI, 7.1% to 26.5%) in the first segment (2012-2016), The trends in females consisted of 1 segment: a significant APC of 7.1% (95% CI, -0.91% to 17.2%) in the first segment (2012-2016). (Table 3)
The most significant findings related to age were that children £ 1 years old had a higher percentage of trauma case fatalities than any other age group. Another significant finding was that 6-year-olds and 9-year-olds had a higher and upward trend for trauma case fatalities than any other age group. The findings depict the presence of age disparities and the increased risk of trauma case fatalities in children, who are £ 1 years old, 6 years old, and 9 years old. (Table 4)
From 2012 to 2016, the age-adjusted trauma case fatality rate among the ≤1 year old age group increased by 10% (2.0 deaths per 100,000 to 2.2 deaths per 100,000), with an average annual increase of 2.5% (AAPC, 2.5%, 95% CI, -8.5% to 15.0%). The age-adjusted trauma case fatality rate among the 1-year-old age group increased by 4.8% (2.1 deaths per 100,000 to 2.2 deaths per 100,000), with an average annual increase of 0.06% (AAPC, 0.06%, 95% CI, -6.9% to 7.1%). The age-adjusted trauma case fatality rate among 2-year-olds increased by 46.7% (1.5 deaths per 100,000 to 2.2 deaths per 100,000), with an average annual increase of 8.1% (AAPC, 8.1%, 95% CI, -0.7% to 18.6%). The age-adjusted trauma case fatality rate among 3-year-olds increased by 60% (1.5 deaths per 100,000 to 2.4 deaths per 100,000), with an average annual increase of 14.3% (AAPC, 14.3%, 95% CI, 2.5% to 31.8%). The age-adjusted trauma case fatality rate among 4-year-olds increased by 58.3% (1.2 deaths per 100,000 to 1.9 deaths per 100,000), with an average annual increase of 10.6% (AAPC, 10.6%, 95% CI, -2.2% to 28.7%). The age-adjusted trauma case fatality rate among 5-year-olds increased by 165.8% (0.79 deaths per 100,000 to 2.1 deaths per 100,000), with an average annual increase of 32.3% (AAPC, 32.3%, 95% CI, 13.0% to 80.5%). The age-adjusted trauma case fatality rate among 6-year-olds increased by 192.7% (0.82 deaths per 100,000 to 2.4 deaths per 100,000), with an average annual increase of 36.3% (AAPC, 36.3%, 95% CI, 18.5% to 83.0%). The age-adjusted trauma case fatality rate among 7-year-olds increased by 122.2% (0.81 deaths per 100,000 to 1.8 deaths per 100,000), with an average annual increase of 18.5% (AAPC, 18.5%, 95% CI, 5.9% to 37.7%). The age-adjusted trauma case fatality rate among 8-year-olds increased by 132.3% (0.99 deaths per 100,000 to 2.3 deaths per 100,000), with an average annual increase of 27.8% (AAPC, 27.8%, 95% CI, 13.0% to 59.0%). The age-adjusted trauma case fatality rate among 9-year-olds increased by 247.8% (0.69 deaths per 100,000 to 2.4 deaths per 100,000), with an average annual increase of 36.4% (AAPC, 36.4%, 95% CI, 19.8% to 72.5%). (Table 3)
The trends in ages ≤1 years old consisted of 1 segment; a significant APC of 2.5% (95% CI, -8.5% to 15.0%) in the first segment (2012-2016). The trends in 1-year olds consisted of 1 segment; a significant APC of 0.06% (95% CI, -6.9% to 7.1%) in the first segment (2012-2016).The trends in 2-year-olds consisted of 1 segment; a significant APC of 8.1% (95% CI, -0.7% to 18.6%) in the first segment (2012-2016). The trends in 3-year-olds consisted of 1 segment; a significant APC of 14.3% (95% CI, 2.5% to 31.8%) in the first segment (2012-2016). The trends in 4-year-olds consisted of 1 segment; a significant APC of 10.6% (95% CI, -2.2% to 28.7%) in the first segment (2012-2016). The trends in 5-year-olds consisted of 1 segment; a significant APC of 32.3% (95% CI, 13.0% to 80.5%) in the first segment (2012-2016). The trends in 6-year-olds consisted of 1 segment; a significant APC of 36.3% (95% CI, 18.5% to 83.0%) in the first segment (2012-2016). The trends in 7-year-olds consisted of 1 segment; a significant APC of 18.5% (95% CI, 5.9% to 37.7%) in the first segment (2012-2016). The trends in 8-year-olds and consisted of 1 segment; a significant APC of 27.8% (95% CI, 13.0% to 59.0%) in the first segment (2012-2016). The trends in 9-year-olds and consisted of 1 segment; a significant APC of 36.4% (95% CI, 19.8% to 72.5%) in the first segment (2012-2016). (Table 3)
From 2012 to 2016, there were a total of 239,944 trauma cases caused by falls, motor vehicle traffic, struck by/against, transport/other, firearm, and cut/pierce among pediatric patients ≤1 to 9 years old. 66.4% of trauma related injuries were caused by falls. 17.0% of trauma related injuries were caused by motor vehicle traffic (MVT), 9.2% of trauma related injuries were caused by being struck by/against, 4.4% of trauma related injuries were caused by transport/other, .79% of trauma related injuries were caused by firearm, and 2.1% of trauma related injuries were caused by being cut/pierced. Based on the findings, falls were the most common cause of trauma related case fatalities in children £1 to 9 years old. (Table 2) (Table 4)
Among children ages ≤ 1 to 9 years old, age-adjusted trauma case fatality rates increased among all age groups and genders between 2012 and 2016. Trauma case fatality percentages were highest in males, and ages ≤1 years old. Trauma case fatality trends were higher and increasing in males, 6-year-olds, and 9-year-olds. Trauma related injuries were most commonly caused by falls. These findings are identical to national and global statistics regarding trauma related fatalities.8 Children are most at-risk of fatalities associated with falls due to evolving developmental stages (i.e., learning to walk), curiosity, and their desire to be risk takers.8 Boys are also more likely to engage in risk taking behaviors.8-9 Due to these and other psychosocial developmental and behavior factors, boys and children, who are £1 years old, 6 years old, and 9 years old have an increased risk of severe trauma related injuries.10 Generally, psychosocial, developmental, and environmental factors tend to play a major role in the increased risk of trauma related injuries in young children.10 For boys, one study identified that boys engage in more adverse home behaviors and may live in environments, where there mother is less attentive or sociable, which increases the risk of severe unintentional injuries.10 Globally, nearly 40% of daily adjusted life years (DALYs) are lost in children due to trauma related falls.8 Other factors associated with trauma case fatalities in children are poor EMS response times, geographical access to care, and poor adult supervision due to socioeconomic factors, such as employment.11
Based on these findings, there needs to be more effort towards improving access to care, EMS response times, and socioeconomic factors attributing to poor supervision of children in families. By addressing these issues, children in the United States will have improved physical and mental health outcomes. It would also reduce trauma case fatality trends in children.
This study has some limitations. First, based on the nature of the study, there is a low capacity to estimate associations. Second, there is a limitation for the study’s timeframe due to the unavailability of public data after 2016, which is why the study focused primarily on findings between 2012-2016. Finally, the analysis was only stratified by age, and sex due to the lack of data on other groups, such as race.
The major strength of this study was its’ use of surveillance data from a national trauma surgery database. The study is also sound because it focuses on analyzing trends and changes over periods of time. The reports and data from the NTDB database are reliable and consistent with both national and global findings.12
From 2012-2016, there was an upward trend of trauma case fatality in the United States in males, 9-year-olds, and 6-year-olds. Males and children ≤ 1 years old had significantly higher trauma case fatality numbers than any other age group, and gender. In the United States, unintentional injuries are the leading cause of death for children.13 More than 7,000 children and teens between the ages of 0-19 died in 2019 due to unintentional injuries.13 The leading cause of death among children and teens were motor vehicle crashes, suffocation, drowning, poisoning, fires, and falls.13 Due to the significant impact of trauma related deaths in children, it is important that the United States initiates more initiatives that will improve access to care within the United States healthcare system, bring awareness to trauma related injuries, specifically falls, and increase the EMS workforce to reduce slow emergency response times to ensure that all children, especially at-risk groups are able to have healthier outcomes.13-21 To implement these strategies, there should be more qualitative and quantitative research to identify trends in trauma case fatalities among children and to identify causes associated with unintentional injuries to assess the needs of young children in relation to injury prevention. Practices/Strategies should also be developed to aid families and general practitioners in providing and implementing strategies that will prevent and mitigate behaviors in children that increase the risk of trauma related injuries. In conclusion, the impact of trauma related fatalities within the United States elicits a need for a strong and inclusive public health and healthcare workforce response, and further statistical analyses.
The authors have no relevant financial disclosures or conflicts of interest.
Elizabeth Jones was born in Vicksburg, MS but has lived majority of her life in the Jackson, Mississippi area. Elizabeth has served as a CDC/CSTE Applied Epidemiology Fellow, a consultant, and as a researcher. Currently, she serves as an Epidemiologist II at the Mississippi State Department of Health within the HIV/STD Unit. She has a bachelor’s degree in sociology/pre-med from Tougaloo College. She also has a master’s degree in public health from Jackson State University. Currently, she is a DrPH student at Jackson State University. Elizabeth was also selected as a student marshal for the College of Health Sciences during the fall graduation ceremony at Jackson State University in 2020, selected as a plenary speaker for the 2nd International Webinar on Physical Health, Nursing Care, and COVID-19 Management, and as a guest lecturer for a CEAL Webinar Session held at the University of Southern Mississippi. She has published 11 articles with 6 articles as 1st author with the topics ranging from COVID-19/infectious diseases to sleep apnea. One of her 1st person publications was awarded the top 100 most-read and top 100 most-cited in IJERPH in February 2024. The paper was also selected as a 2nd prize winner of IJERPH 2021 Best Paper Award. She also served as a reviewer for several journals and the American Public Health Association Conference and as a technical editor for the recently published book entitled, Epidemiology for Dummies. She is also an author of a book chapter entitled, Epidemiology of Childhood Sleep Apnea. She was also selected as Marquis Who’s Who of America 2024. Elizabeth is also an editorial board member for MED DOCS-Depression and Anxiety.
BCPHR.org was designed by ComputerAlly.com.
Visit BCPHR‘s publisher, the Boston Congress of Public Health (BCPH).
Email [email protected] for more information.

Click below to make a tax-deductible donation supporting the educational initiatives of the Boston Congress of Public Health, publisher of BCPHR.![]()
© 2025-2026 Boston Congress of Public Health (BCPHR): An Academic, Peer-Reviewed Journal
All Boston Congress of Public Health (BCPH) branding and content, including logos, program and award names, and materials, are the property of BCPH and trademarked as such. BCPHR articles are published under Open Access license CC BY. All BCPHR branding falls under BCPH.
Use of BCPH content requires explicit, written permission.