Mixed Method Longitudinal Nursing Burnout and Shortage Research:
Core Data Tracker Tools for Field Notes and Data Statistics to Systematically Plan and Manage the Implementation

By Natasha Barrow, MSN, RN; Dr. Connie Kim Yen Nguyen-Truong, PhD, RN, ANEF, FAAN; Dr. Denise A. Smart, DrPH, MPH, BSN, RN, BA, NHDP-BC; and Dr. Lois James, PhD

Facebook
Twitter
LinkedIn

Citation

Barrow N, Kim Yen Nguyen-Truong C. Smart D, James L. Mixed method longitudinal nursing burnout and shortage research: core data tracker tools for field notes and data statistics to systematically plan and manage the implementation. HPHR. 2024;87. https://doi.org/10.54111/0001/IIII5

Mixed Method Longitudinal Nursing Burnout and Shortage Research: Core Data Tracker Tools for Field Notes and Data Statistics to Systematically Plan and Manage the Implementation ​

Abstract

Introduction

A critical nursing shortage exists that is rapidly growing into a public health crisis both in the United States and worldwide. Globally, we have the loss of nurses outpacing the introduction of new nurses into the workforce. The need for research to evaluate the contributors to this phenomenon is imperative. This brief article describes the strategic creation, implementation, and evaluation on the strengths, modifications, and utility of Core Data Tracker Tools for primary data collection, addressing 6 key areas, to organize, systematically track, and calculate various data for the quantitative portion of mixed method longitudinal exploratory design. The 6 areas are the following: Nursing Program Tracker, Descriptive Data Collection Tracker, Completion Rate Tracker, Attrition Rate Tracker, Sample Size Tracker, and Survey Send out Dates and Reminders.

Strategies

Two Core Data Tracker Tools for primary data collection – the Core Field Notes-Based Data Collection Tracker and the Core Data Statistics Tracker – were created to plan, implement, and evaluate a mixed method longitudinal research on nursing student burnout and its impact on transition to practice and intent to leave.

Recommendations

A recommendation is to use the adaptable data tracker tools to facilitate clear, concise, and up-to-date information between team members and among the partnership to keep track of next steps. We encourage teams and partnerships to discuss granular level needs for systematic data tracking while building in a process evaluation to meet the evolving needs of the research for extending recruitment reach and retention. The tracker tools are intended to be adaptable to maximize the depth of information gathered and shared during the research process and encourage teams and partnership from different sectors and disciplines to modify the tracker tools to meet the needs of the project or programming.

Conclusions

The creation, implementation, and evaluation of the Core Data Tracker Tools allowed for systematic organization, planning, and management of the implementation of primary data collection for the quantitative portion of the mixed method longitudinal study. The tracker tools helped facilitate communication between team members and allowed for real-time analysis of data during the research. Excel spreadsheets were created for the different data tracker areas along with formulas used to analyze the data and made available for download for adaptation.

Introduction

There is a critical nursing shortage worldwide, with the loss of nurses outpacing the introduction of new nurses to the workforce. In the United States (U.S.), between 2022 and 2032, there is an estimated need of approximately 193,000 nurses per year due to losses related to retirement and workforce exits.1,2 There is also a projected 6% employment growth in the U.S., approximately 177,000 nurses by 2032.2 In the U.S., an average of one out of five newly licensed registered nurses (NLRNs) will leave the field within the first year, and by two years, over 1/3 more will leave the nursing field.3-5 This loss equates to about 31,000 nurses the first year and an additional 40,000 NLRNs the second year.6 The U.S. graduates approximately 155,000 nurses per year, which creates a deficit between need and supply of approximately 38,000 nurses each year.6 What is even more concerning is that enrollment into nursing programs has decreased by about 10% [88,960 enrolled in 2023] which contributes to shortages based on projected national needs in the workforce.1 Research shows the nursing shortage is a rapidly growing public health crisis.

While this is a critical crisis, this nursing shortage is not limited to the U.S. Canada documented a 60,000-nurse shortage in 2022, with predictions up to 117,000 nurse shortage by 2030.7 The European Union, in their Nurses’ Early Exit Study (NEXT) showed an average of 9.3% of new European Nurses leaving the healthcare field.4 In 2022, the International Council of Nurses (ICN) released a report indicating a need of 13 million more nurses over the next decade worldwide. NLRN’s are needed to close the gap, however this data shows a high trend of loss of NLRN both nationally and internationally.7 An identified gap in the literature is whether there is a relationship between burnout, perceived stress, and generalized health on intent to leave the nursing workforce after the first six months post-graduation. A secondary gap is whether there is a connection between burnout levels in graduating nurses, burnout levels after 6-months post-graduation, and intent to leave the nursing workforce.

In 2023, a literature search in major databases, Cumulative Index to Nursing and Allied Health Literature (CINAHL), PubMed, and SearchIT, with a combination of keywords, included mixed methods, burnout, nursing student, longitudinal research, showed a paucity in research, specifically on the impact of burnout in the final academic term and within the first six months post-graduation specific to intent to leave the workforce for Associate Degree of Nursing (ADN) and Baccalaureate of Science in Nursing (BSN). The Doctor of Philosophy (PhD) Candidate in Nursing (first author) designed, implemented, and debriefed with 3 Nursing (second author & third author) and Health Science (fourth author) faculty scientists on a systematic longitudinal mixed method research to examine the impact of burnout, stress, and sociodemographic data on intent to leave the workforce. Nursing students and NLRNs are caring for the growing needs of diverse populations in many nursing practice areas (e.g., public health/population health/community health, acute and critical care, medical-surgical, emergency care, ambulatory, operating care, palliative care, hospice care, administration, management, education, and more can be found at https://www.aacnnursing.org/news-data/fact-sheets/nursing-workforce-fact-sheet).8 We are cognizant that research on the impact of burnout on nursing student transition to practice from a mixed methods and longitudinal cohort study lens is emerging.9

Thus, the purpose of this brief article is to describe the strategic creation, implementation, and evaluation on strengths, modifications, and utility (i.e., usefulness) of 2 Core Data Tracker Tools with 6 key data areas for primary data collection – Core Field Notes-Based Data Tracker Tool and Core Data Statistics Tracker Tool, to organize, systematically track, and calculate various data for the quantitative portion of mixed method longitudinal exploratory design of this nature and scope as a foundation to address the identified gap. This addresses rigor in systematic planning, implementing, and evaluating the research on burnout, perceived stress, and generalized health on intent to leave the nursing workforce. This article details rationales examples of collected data, and recommendations for consideration in the utility of such tools. We provide downloadable copies of the Core Data Tracker Tools as Excel spreadsheets intended to be adaptable that include formulas used to calculate descriptive statistics. While this is a mixed method longitudinal research study, qualitative data collected through key informants via one-on-one conversation is not the focus of this article.

Recruitment and Primary Data Collection Context

A mixed method longitudinal exploratory design was used to research burnout levels in graduating nurses, assess trends in burnout at four timepoints, perceived stress measurement, and the impact to intent to leave the nursing workforce. Quantitative data was collected via surveys from pre-licensure ADN and BSN nursing students at the beginning and end of the final academic term, 3 months post-graduation, and 6 months post-graduation. Qualitative data was collected from key informants via one-on-one interviews and focus groups and is not discussed for this article’s purpose. Initially, the intention was to collect data from one cohort; however, with low recruitment participation, the study was extended to include 4 additional cohorts.

Ethics

Washington State University Human Research Protection Program (Institutional Review Board [IRB]) has certified as exempt research (#20201-001).

Strategies

Data Collection Overview: Creation, Implementation, and Evaluation of Core Data Tracker Tools

For this study, quantitative data is being collected via survey at 4 timepoints, collected from pre-licensure nursing students graduating in Fall 2023, Winter 2024, and Spring 2024. Students were recruited from both Washington and Oregon states in the U.S. Pacific Northwest.

Core Field Notes-Based Data Collection Tracker Tool

Nursing Program Tracker

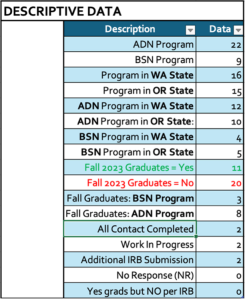
The first step of this research was to determine what nursing programs were available in both Washington and Oregon states and which academic terms did they graduate nurses. Using the respective states department of health websites, the PhD Candidate created an excel tracker that allowed for systematic and methodical organization and analysis of the information of all nursing schools. The strengths of this spreadsheet included the school’s name, program type (ADN or BSN), city and state, term of graduation, maximum cohort size, current cohort size, contact person, and contact information. Also included was field note information regarding 1st contact and follow up contact, including observations and impressions on what worked or did not work, and whether additional IRB submission was required. The original Nursing Program Tracker was modified based on data collected on nursing programs for each graduating term (i.e. Fall 2023, Winter 2024, Spring 2025). We found this to be an accurate and useful program tracker tool to organize big data and maintain timely field notes-based data. Refer to Figure 1 for example of school related data information specifics in the black highlighted section.

Figure 1. Nursing Program Tracker
Note. Tracker for all school-related information as shown in the sample layout of the column header row (in black). Foundation for descriptive statistics based on school data.
Descriptive Data Collection
Descriptive data from the Nursing Program Tracker was collected using CountIf formulas in the Excel workbook. The Excel CountIf is a statistical function that will count the number of cells within a range that meets the specific criteria the user inputs.10 An example of descriptive data collected using the Countif formula is how many programs had Fall graduates and was a BSN program. Refer to Figure 2 for examples of descriptive data collected from the Nursing Program Tracker Tool.
Figure 2. Descriptive Data Collection
Note. Descriptive statistics based on the overall data collection tracker. Excel function CountIf was used to calculate each row.

Core Data Statistics Tracker Tool

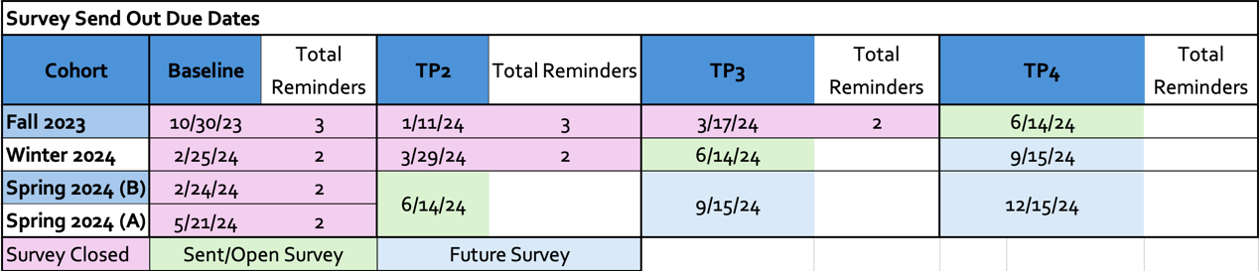
The Core Data Statistics Tracker Tool allowed for tracking and summarizing of data across three cohorts graduating at three different timepoints. Survey data was collected from each of the cohorts at four different timepoints across a 9-month timespan. The strengths of this spreadsheet allowed for calculating data across an individual cohort, and amalgamation of the data into a combined unit for analysis. Using this spreadsheet, the first author organized, synthesized, tracked data related to sample size, response rate, completion rate, completeness, and attrition of both the individual cohorts and combined cohorts. The usefulness of this tracker allowed the first author and team to pool the data from different cohorts into one spreadsheet and see the entire scoping picture of the data rather than data from individual cohorts.

Completion Rate Tracker
Response rate data from survey submissions was assessed from four different perspectives. Initial data, or baseline data, was the number of surveys sent to interested participants. Started data is the number of participants who received the survey and started the survey. Response rate is the number of people started divided by the number of surveys sent. Completion rate indicates the number of individuals who submitted the last page of the survey, whether the survey was fully completed or not. Completeness rate are the numbers of surveys that were completed in its entirety,11 with completeness rate being the number of completeness surveys/the number of completion surveys. Formulas were entered into the trackers to calculate the response rate, completion rate, and completeness rate. Refer to Figure 3 for a sample of the Completion Rate Tracker.
Figure 3. Completion Rate Tracker
Note. Completion rate tracker based on participant response.
Attrition Rate Tracker

The next step in this process was the attrition rate tracking. The strength of the attrition rate tracker allowed for real time analysis of student attrition of the study. Attrition rate was examined from an individual cohort perspective, a combined completeness perspective, and attrition by sample size. The PhD candidate created formulas using the Excel Sum function (addition of numbers within a designated range), and division with percent formatting to calculate the attrition rates. The attrition data tracker helped with regular assessment of study sample size through participant engagement and attrition rates. Refer to Figure 4 for a sample of the attrition rate data tracker.

Figure 4. Attrition Data Tracker
Note. Attrition data tracker was calculated using data from the Completion Rate Tracker.
Sample Size Tracker

The last data set on the overall statistics tracker was sample size tracking. Sample size was assessed per cohort (Fall 2023, Winter 2024, Spring 2024), combined per time point, and assessed with completeness survey submission. The SUM function in Excel was used to calculate this data. The sample size tracker in combination with the attrition rate tracker allowed for the overarching picture of participant engagement and attrition. Refer to Figure 5 for a visual display of the sample size tracking.

Figure 5. Sample Size Data Tracker
Survey Send Out Dates and Reminders
Figure 5. Sample Size Data Tracker
Note. Sample size was calculated based on the initial participant sample and the number of completeness survey submission.
Keeping track of multiple cohorts at different timepoints in a longitudinal study can be challenging. To help with management of survey timelines and keeping track of the number of reminders submitted per cohort, a color-coded chart was created. The use of colors to code was a strength in managing multiple areas and helped with quick identification of status and tasks to be completed. For example, purple was used to identify surveys completed and closed, while green was used to code those items that were open but sent to participants. Refer to Figure 6 for a visual display of the data collection due date timeline.
Figure 6. Survey Send Out Dates and Reminders
Figure 6. Survey Send Out Dates And Reminders
Note. This tracker was used to maintain the trajectory of the research project to ensure meeting deadlines

Downloadable Core Data Tracker Tools

Limitations

A limitation to the Core Data Tracker Tools is related to what was known about formulas for Excel at the time of the creation of these tools for utility. To help mitigate this, the recommendation is to review Microsoft Excel support to assist with creating and maintaining formulas while considering the scope of such software program. LaPolla12 notes that Excel has limitations as a data tracking and data visualization tool due to some of its more complex or advanced knowledge requirements to fully utilize its built-in features and capabilities that go beyond data storage and visualization. This type of limitation requires additional advanced training when using Excel.

Implications and Recommendations

As a first step in the study, the PhD candidate determined how many nursing programs existed within Washington and Oregon States. There were about 60 nursing programs that required accessing the individual nursing school websites for contact information and program information before contacting each school. The need to create tracker tools permits complete, accurate, and real-time field notes and using large data sets was imperative. With each step of the study, the PhD candidate added those described tracker areas of the Core Data Tracker Tools with regular debriefs with expert team members and as a partnership to meet the needs of the study. A recommendation is for nursing programs to value the need for granular level data collection tracking for rigor in retrieval through adopting a consistent approach or strategies to how their program data are represented to the public. This can help with ease in accessibility and readability.

Managing a longitudinal cohort mixed method study can be challenging, and we encourage teams and partnerships to discuss granular level needs for systematic data tracking while building in a process evaluation to meet the evolving needs of the research for extending recruitment reach and retention. An implication of the tracker tools was its utilization to facilitate regular communication of research information and progress by the PhD Candidate to the research team members. A recommendation is to use the adaptable Core Data Tracker Tools to facilitate clear, concise, and up-to-date information between team members and among the partnership to keep track of next steps. The tracker tools are intended to be modifiable to maximize the depth of information gathered and shared during the research process and encourage modification of the tracker tools to meet the needs of the project or programming.

Lastly, the Core Data Tracker Tools provided our research team with a means to debrief regularly about usefulness and validity of the information in the data trackers. Thus, a recommendation for different teams and partnerships is to build in rigor about what information is vital and value added to the research and identify areas that are both outside the scope of the research questions and in support of the research goals. Utilizing these data tracker tools can help in identifying areas of change in real-time while completing the research.

Having useful tools to help strengthen primary quantitative data collection is essential to completing a mixed method research study. We recommend the use of the adaptable Core Data Tracker Tools by different institutions, for example, by academic and public health institutions in the public sector, healthcare organizations in the not-for-profit sector, community-based organizations in the non-profit sector, and information management business organizations in the for-profit sector. For example, hospital systems can use the Core Data Tracker Tools to have real-time tracking, implementation, and analysis of data across nurse residency programs, as newly licensed registered nurses transition to practice. We encourage partnerships to consider expanding in working across sectors and disciplines in addressing public health crisis issues in allyship. Use of the Core Data Tracker Tools can help to bridge necessary and authentic communications and decision-making in real-time for transparency, rigor, and robust systematic planning and managing multiple big data across timepoints. This can holistically strengthen the overall longitudinal design.

Conclusions

The creation, implementation, and evaluation of the Core Field Notes-Based Data Tracker Tool and Core Data Statistics Tracker Tool allowed for systematic organization, planning, and management of implementation of primary data collection for the quantitative portion of the mixed method longitudinal study. The creation of formulas assisted with collecting descriptive statistics from a cohort perspective and from an overall research perspective in real-time. These data tracker tools can help researchers to address rigor and systematically organize their thoughts, identify areas of improvement or changes in the research for decision-making in real-time, and gain an overall data visualization of the research in real-time. Excel spreadsheets were created for the different data tracker areas along with formulas used to analyze the data and made available for download for adaptation.

References

  1. American Association of Colleges of Nursing. Fact sheet: nursing shortage. ttps://www.aacnnursing.org/Portals/0/PDFs/Fact-Sheets/Nursing-Shortage-Factsheet.pdf; 2024. Accessed May 15, 2024
  2. United States Bureau of Labor Statistics. Registered Nurses: job outlook. https://www.bls.gov/ooh/healthcare/registered-nurses.htm#tab-6; 2022. Accessed May 15, 2024
  3. Brook J, Aitken LM, MacLaren JA, Salmon D. An intervention to decrease burnout and increase retention of early career nurses: a mixed methods study of acceptability and feasibility. BMC Nursing. 2021;20:1-12. doi:10.1186/s12912-020-00524-9
  4. Chachula KM, Myrick F, Yonge O. Letting go: how newly graduated registered nurses in Western Canada decide to exit the nursing profession. Nurse Educ Today. 2015;35(7):912-918. doi:10.1016/j.nedt.2015.02.024
  5. Moore A, Parks K, Beckling A. Transitioning from student to new graduate nurse. Nursing Made Incredibly Easy! 2020;18(1):51-55. doi:10.1097/01.NME.0000613640.59831.f1
  6. Salsberg ES. (2018). Changes in the pipeline of new NPs and RNs: implications for health care delivery and educational capacity. Health Affairs Forefront. https://www.healthaffairs.org/content/forefront/changes-pipeline-new-nps-and-rns-implications-health-care-delivery-and-educational#:~:text=Registered%20Nurses,-The%20inflow%20of&text=The%20annual%20number%20of%20RN,per%20year%20(Exhibit%202)
  7. Baumann A, & Crea-Arsenio M. The crisis in the nursing labour market: Canadian Policy Perspectives. Healthcare (Basel, Switzerland). 2023;11(13):1954. doi:10.330.3390/healthcare11131954
  8. American Association Colleges of Nursing. Nursing workforce fact sheet; 2024. Accessed July 10, 2024.
    https://www.aacnnursing.org/news-data/fact-sheets/nursing-workforce-fact-sheet
  9. Galdino MJQ, Almeida LPBM, Silva LFR, Cremer E, Scholze AR, Martins JT, Haddad MCFL. Burnout among nursing students: a mixed method study. Invest Educ Enferm. 2020;38(1):e07. doi: 10.17533/udea.iee.v38n1e07
  10. Microsoft Excel. CountIF function. https://support.microsoft.com/en-us/office/countif-function-e0de10c6-f885-4e71-abb4-1f464816df34?ns=macexcel&version=90&ui=en-us&rs=en-us&ad=us. 2024. Accessed May 15, 2024
  11. Eysenbach G. Improving the quality of web surveys: The checklist for reporting results of internet e-surveys (CHERRIES). J Med Internet Res. 2004;6(3). doi:10.2196/jmir.6.3.e34
  12. LaPolla FWZ. Excel for data visualization in academic health sciences libraries: a qualitative case study. J Med Libr Assoc. 2020;108(1):67-75. doi:10.5195/jmla.2020.749.

Author Contributions

The following are individual contributions from authors who have contributed substantially to the work reported: conceptualization by NB (lead) and CKYN-T (support); data curation, NB (lead) and CKYN-T (support); formal analysis, NB (lead), CKYN-T (support), LJ (support), and DAS (support); funding acquisition, NB (lead) and CKYN-T (support); investigation, NB (lead), CKYN-T (support), DAS (support), and LJ (support); methodology, NB (lead), CKYN-T (support), DAS (support), and LJ (support); project administration, NB (lead), CKYN-T (support), and LJ (support); resources, NB (lead) and CKYN-T (support); software, NB (lead), CKYN-T (support), and LJ (support); supervision, CKYN-T (lead) and LJ (support); validation, NB (lead), CKYN-T (support), DAS (support), LJ (support); visualization, NB (lead); writing – original draft, NB (lead); and writing – review & editing, NB (lead), CKYN-T (lead), DAS (support), and LJ (support).

Acknowledgements

The authors are appreciative of the following funding. Natasha Barrow, MSN, RN, PhD Candidate, was awarded Acel and Barbara Brown Nursing Scholarship that supports the overall research. Dr. Connie KY Nguyen-Truong received the Washington State University Vancouver Nursing Faculty Development Fund that funded the dissemination.

Disclosure Statement

The authors have no relevant financial disclosures or conflicts of interest.

About the Author

Natasha Barrow, MSN, RN

Natasha Barrow is a tenured faculty at Bellingham Technical College, Nursing Department, in Bellingham Washington. She is a PhD Candidate in the College of Nursing at Washington State University Spokane Health Sciences. Her research interests include equity and diversity in healthcare and education, and researching health and wellness, burnout, and compassion fatigue in nursing students and licensed nurses.

Dr. Connie Kim Yen Nguyen-Truong, PhD, RN, ANEF, FAAN

Dr. Connie K Y Nguyen-Truong (she/her/they) is a tenured Associate Professor at Washington State University, Department of Nursing and Systems Science, College of Nursing in Vancouver. She is recognized as a Martin Luther King Jr. Community, Equity, and Social Justice Faculty Honoree, March of Dimes Distinguished Nurse Hero, and by the American Association Colleges of Nursing for Excellence and Innovation in Teaching. She is a Fellow of the National League for Nursing Academy of Nursing Education, American Academy of Nursing, and Coalition of Communities of Color Leaders Bridge – Asian Pacific Islander Community Leadership Institute. Her program of research is cross-sectoral and multidisciplinary/transdisciplinary, and with community and health organizations and leaders, community health workers, student scholars, and scientists. Areas include mentorship, health promotion and health equity, culturally specific data and disaggregated; immigrants, refugees, and marginalized communities; community-based participatory/action research and community-engaged research; parent/caregiver leadership, disability leadership justice, and early learning; diversity and inclusion in health-assistive and technology research including adoption; cancer control and prevention, and anti-racism. Dr. Nguyen-Truong received her PhD in Nursing, including health disparities and education, and completed a Post-Doctoral Fellowship in the Individual and Family Symptom Management Center at Oregon Health & Science University School of Nursing.

Dr. Denise A. Smart, DrPH, MPH, BSN, RN, BA, NHDP-BC

Dr. Denise Smart is a Professor at Washington State University, College of Nursing. Her research focuses on civilian and military health care workers and nurse’s safety and well-being, burnout, and compassion fatigue. She has received several awards from a military research funding agency for her work with National Guard medical personnel and other military disaster response teams focusing on simulation and skills for medics, military nurses and other health care providers, sleep quality, safety and heat injury assessment and prevention. She recently was awarded the 2024 YWCA Woman of the Year for Science, Technology and Environment for her work with nursing students, junior faculty, and military personnel that improves the lives of nurses and other health care team members.

Dr. Lois James, PhD

Dr. Lois James is the Assistant Dean of Research and an Associate Professor in the Washington State University (WSU) College of Nursing, where she focuses on the impact of sleep loss, fatigue, stress, and bias on performance and safety in shift workers such as police officers, firefighters, health care personnel, and military personnel. She has received multiple honors and awards for her work and is internationally recognized as a leading expert in her field. She specializes in developing, implementing, and evaluating fatigue risk management and sleep education programs. She is also the founding director of Counter Bias Training Simulation (CBTsim), a novel and innovative simulation-based anti-bias training program that has been featured in National Geographic and the feature-length documentary “bias.” Dr. James’s work has been published extensively in academic journals, practitioner magazines, and mainstream media such as the New York Times and the Washington Post. During her time at WSU, James has brought in approximately $7,000,000 of extramural funding, making her an important contributor to WSU’s “Drive to 25” goal of being recognized as one of the nation’s top 25 public research universities, preeminent in research and discovery, teaching, and engagement by 2030.