
Schroeder K, Thompson K, Kosaraju M, Miller D, Troppy S, Geller A. Social vulnerability and pediatric infectious disease: COVID-19 as a case study in Massachusetts towns. HPHR. 2024;84. https://doi.org/10.54111/0001/FFFF02
The purpose of this research is to evaluate the relationship between town-level social vulnerability and pediatric COVID-19 cases during the 2021-2022 school year in all 351 Massachusetts towns.
This observational study used the census-based Social Vulnerability Index (SVI, our key independent variable) and ecological data for COVID-19 cases, PCR testing, and vaccinations at the town level. Multilevel mixed models were used to examine the relationship between SVI and pediatric COVID-19 case rates in two age groups.
For children ages 5-11, living in the most socially vulnerable towns (SVI Quintile 5) was associated with an increase of 2,751 COVID-19 cases per 100,000, relative to the middle category (95% CI: 1,528 – 3,973). For children ages 12-18, residing in SVI Quintile 5 was associated with 3,177 additional COVID cases per 100,000 (95% CI: 2,185 – 4,169), and an increase was also observed for SVI Quintile 4. In both age groups, there was a positive trend in COVID-19 cases across social vulnerability quintiles.
Children from socially vulnerable towns experienced a greater burden of disease during the COVID-19 pandemic. Social vulnerability index data may aid public health officials and school health personnel in directing resources to mitigate harms for children in future infectious disease outbreaks.
Our main outcome variable was pediatric COVID-19 cases per 100,000. Age-specific case counts and population estimates were provided in aggregate form for towns by a data request process through the Massachusetts Department of Public Health (MDPH). These data were used to calculate case rates per 100,000 individuals in each age group. Each week, the MDPH published cumulative and weekly age-specific case counts for all 351 towns. MDPH case reports only included positive PCR tests.
We also included several covariates. Town-level vaccination rates for each age group were tabulated from publicly available MDPH reports. We defined vaccinated individuals as those who have received at least two doses of a Pfizer or Moderna mRNA vaccine or one dose of the Johnson & Johnson vaccine. Vaccine rates reported as “>95%” for a particular age group were recorded as 97.5% for the analysis. Vaccination rates included 19-year-olds in the 12-19 age group, while the case data included only those up to 18 years. When fewer than 30 doses were recorded for a particular age group and town, the vaccination rate for that age group was excluded from the dataset. This yielded 346 towns for the ages 5-11 years analysis and 331 towns available for the ages 12-18 years analysis. The town-level vaccination rate for residents ages 18+ was not included as a covariate due to collinearity with the pediatric vaccination rate.
We obtained PCR testing data from public MDPH reports, using the date range of 9/11/21-1/15/22 as the closest available match to our case data. Age group breakdowns were not available for testing data, so we incorporated them in the model as PCR tests per 100,000 for the overall town population.
Town population size was obtained through the SVI database, which uses estimates from the 2018 American Community Survey.2,15
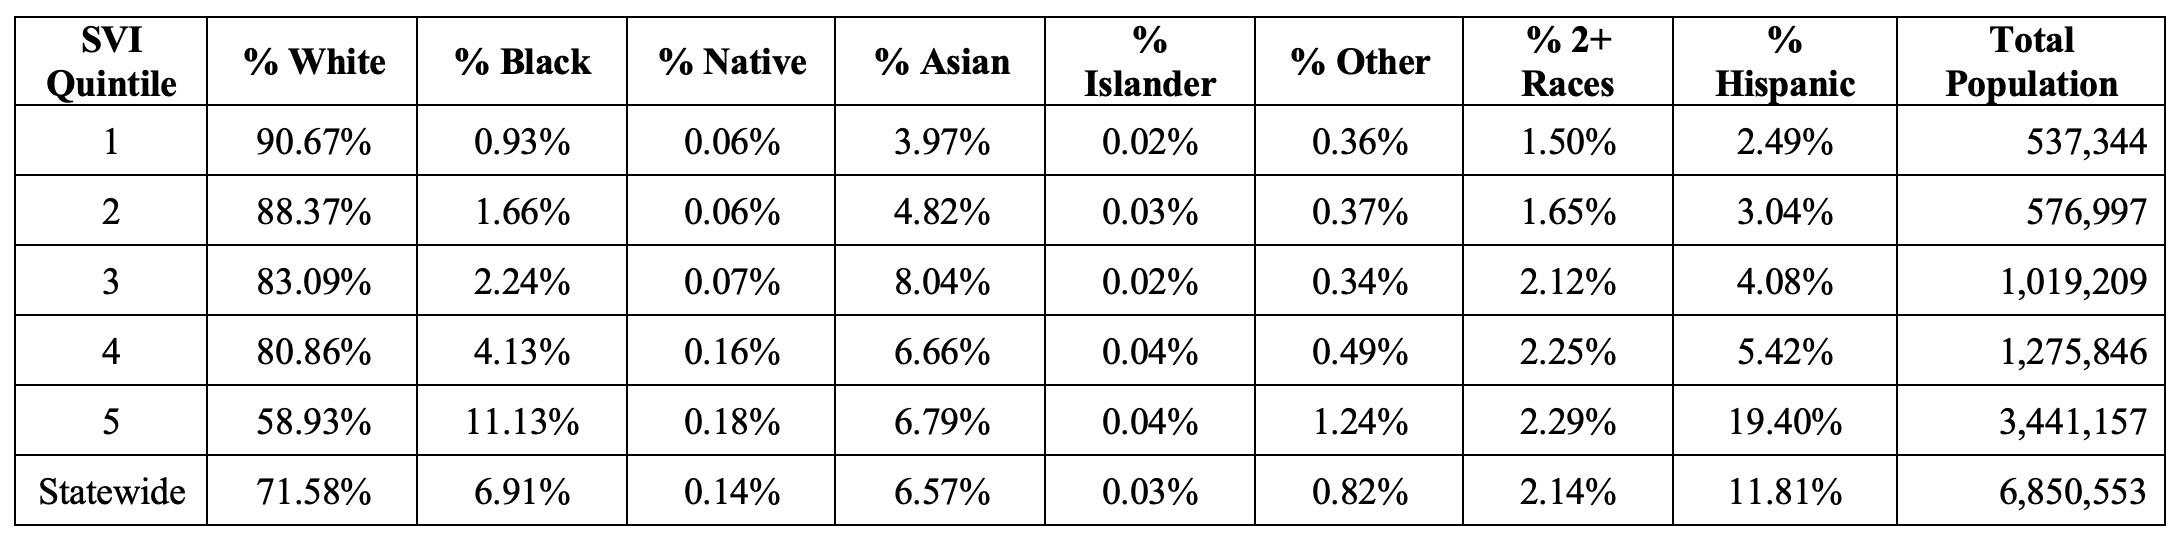
Finally, we did not include race and ethnicity as covariates since they are already components of SVI Theme 3. Instead, we used American Community Survey estimates of seven categories of race/ethnicity for descriptive purposes.16
Descriptive statistics were reported for case rates, vaccination rates, PCR testing rates, town population, and race and ethnicity for each quintile of SVI. Multilevel models were used to investigate the relationship between SVI composite score quintile and pediatric COVID-19 case rates. These models included random intercepts at the county level, to account for similarities among towns within the same counties. In all models, SVI Quintile 3 was the reference category. Unadjusted and adjusted regression models were performed and were stratified by age (5-11 years and 12-18 years). For the adjusted models, town-level covariates were added in a stepwise approach: % fully vaccinated, PCR tests per 100,000 town residents, and town population size.
To test for trend, we obtained Spearman’s rank correlation coefficients for each age group to ascertain the strength and direction of correlation between case rates and SVI Quintile in the 351 towns. Several additional analyses were performed to better understand the influence of different domains of social vulnerability. Multilevel models were used to examine the relationship between each of the SVI theme scores and COVID-19 cases in the two age groups. These results were in line with our main analyses.
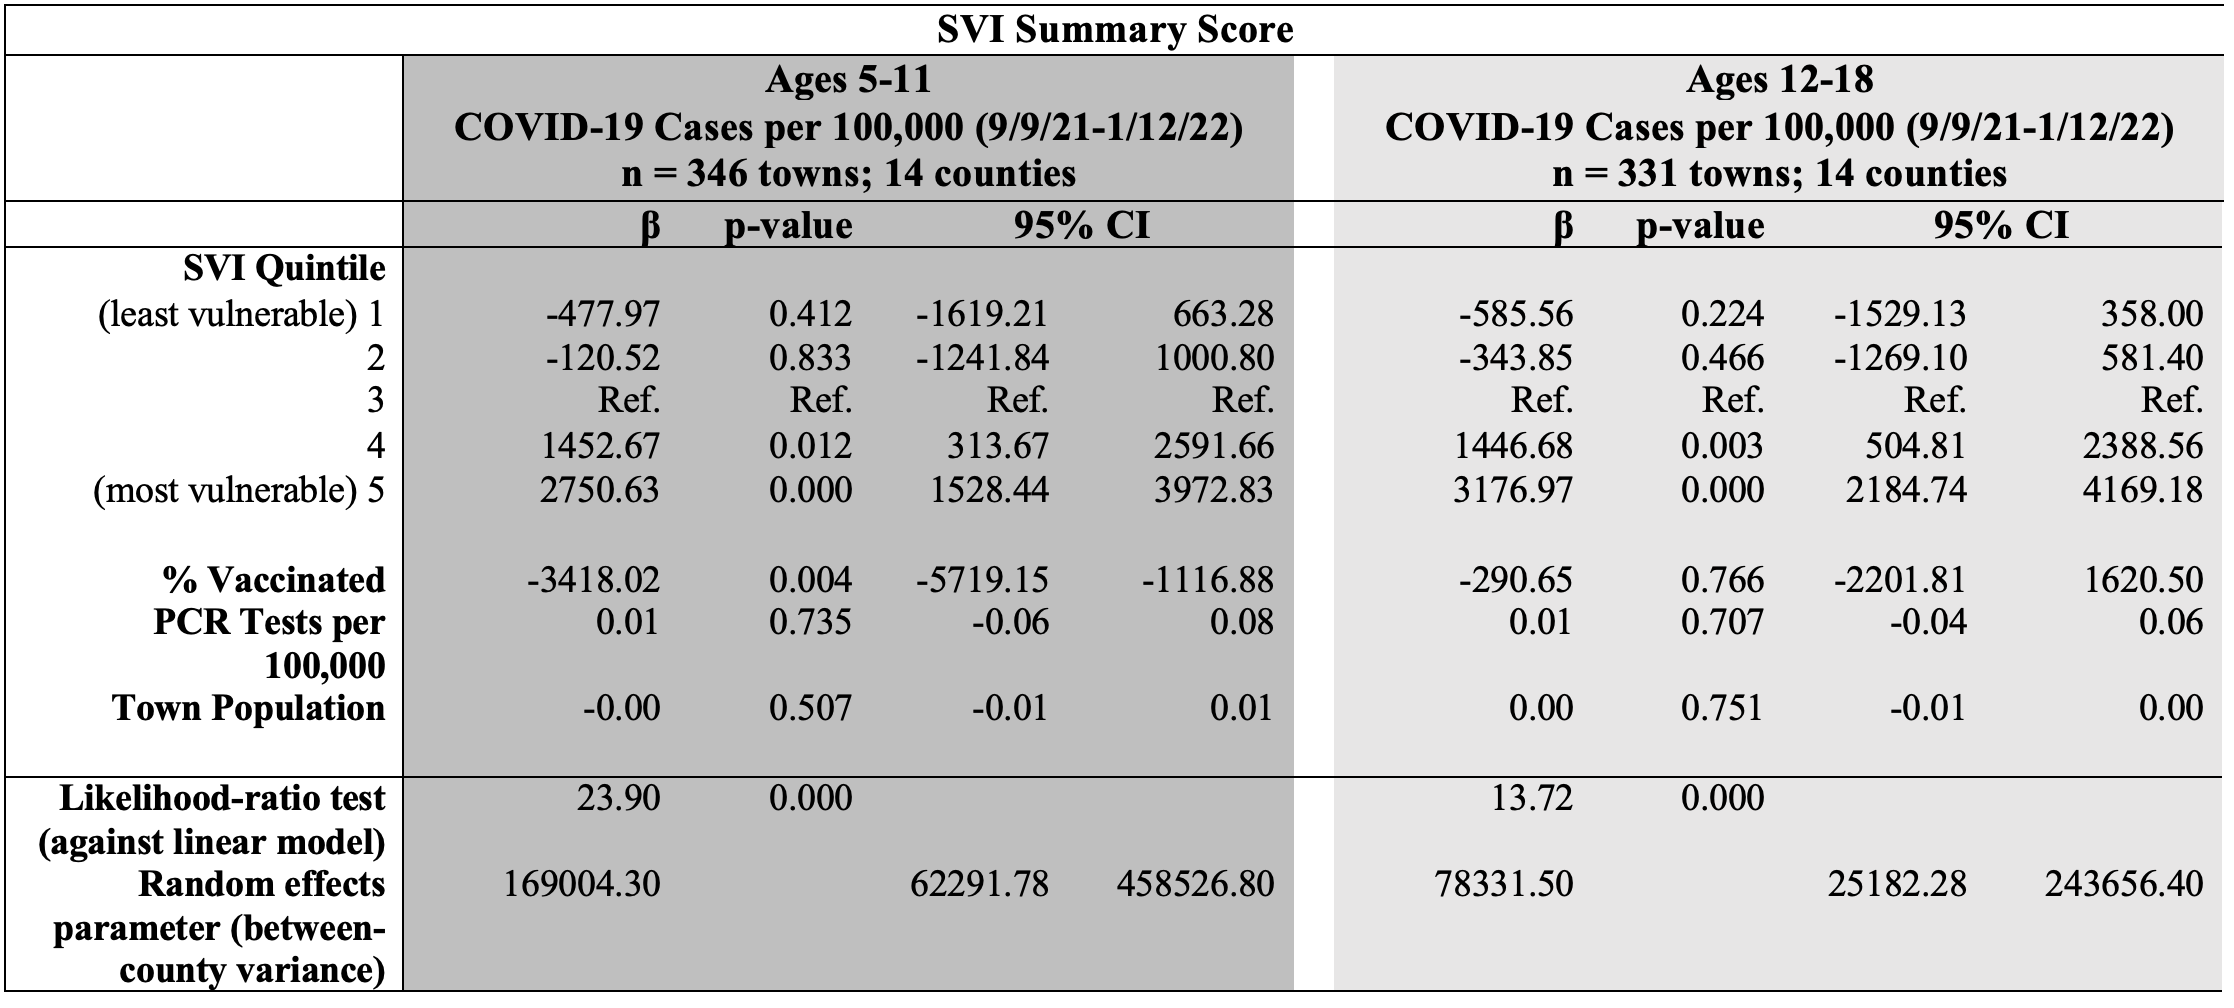
The results of the multilevel models, examining SVI’s relationship to COVID-19 cases, are reported in Table IV for both 5 to 11 and 12 to 18 year-olds. Among children ages 5-11, being in the fifth SVI quintile (the most socially vulnerable towns) was associated with an increase of 2,751 COVID-19 cases per 100,000 [95% CI: 1,528 – 3,973], relative to being in the third SVI quintile. Being in the fourth SVI quintile (with the second-most vulnerable towns) was also associated with higher case rates, relative to being in the third SVI quintile. Decreases in case rates were observed for children in the least socially vulnerable towns (SVI Quintiles 1 and 2) when compared with SVI Quintile 3, but the differences were not statistically significant. We observed a positive trend in case rates by SVI Quintile, with a Spearman correlation coefficient of 0.39 (p < 0.001).
The results of the multilevel models, examining SVI’s relationship to COVID-19 cases, are reported in Table IV for both 5 to 11 and 12 to 18 year-olds. Among children ages 5-11, being in the fifth SVI quintile (the most socially vulnerable towns) was associated with an increase of 2,751 COVID-19 cases per 100,000 [95% CI: 1,528 – 3,973], relative to being in the third SVI quintile. Being in the fourth SVI quintile (with the second-most vulnerable towns) was also associated with higher case rates, relative to being in the third SVI quintile. Decreases in case rates were observed for children in the least socially vulnerable towns (SVI Quintiles 1 and 2) when compared with SVI Quintile 3, but the differences were not statistically significant. We observed a positive trend in case rates by SVI Quintile, with a Spearman correlation coefficient of 0.39 (p < 0.001).
Among 12 to 18 year-olds, being in the fourth and fifth SVI quintile was associated with an increase of 1,447 [95% CI: 505 – 2,389] and 3,177 [95% CI: 2,185 – 4169] COVID-19 cases per 100,000 children, respectively, relative to being in the third SVI quintile (Table IV). The rates were lower but not statistically different for those residing in towns in SVI Quintiles 1 and 2 relative to SVI Quintile 3. The Spearman correlation coefficient for SVI Quintile and case rates in this age group was 0.47, indicating a moderate, positive correlation (p < 0.001).
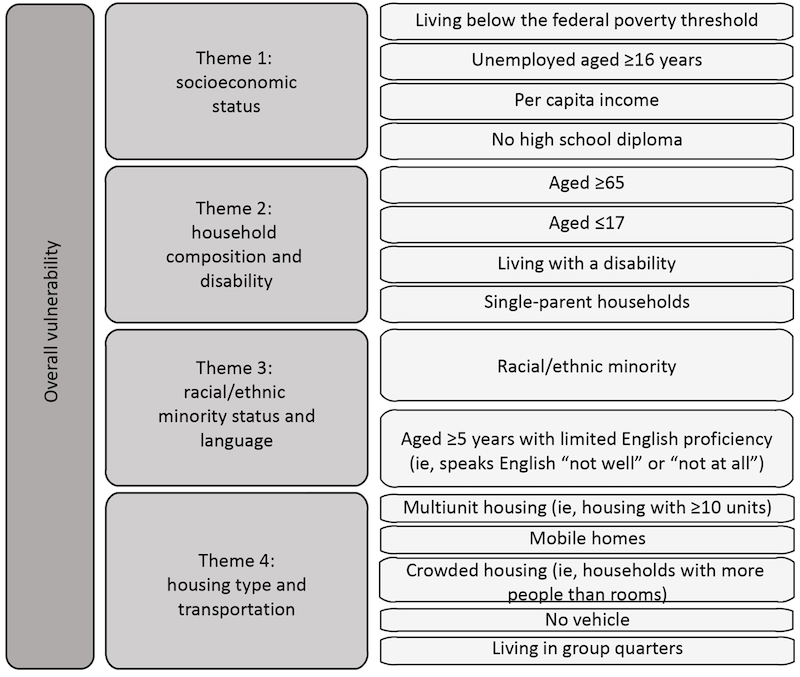
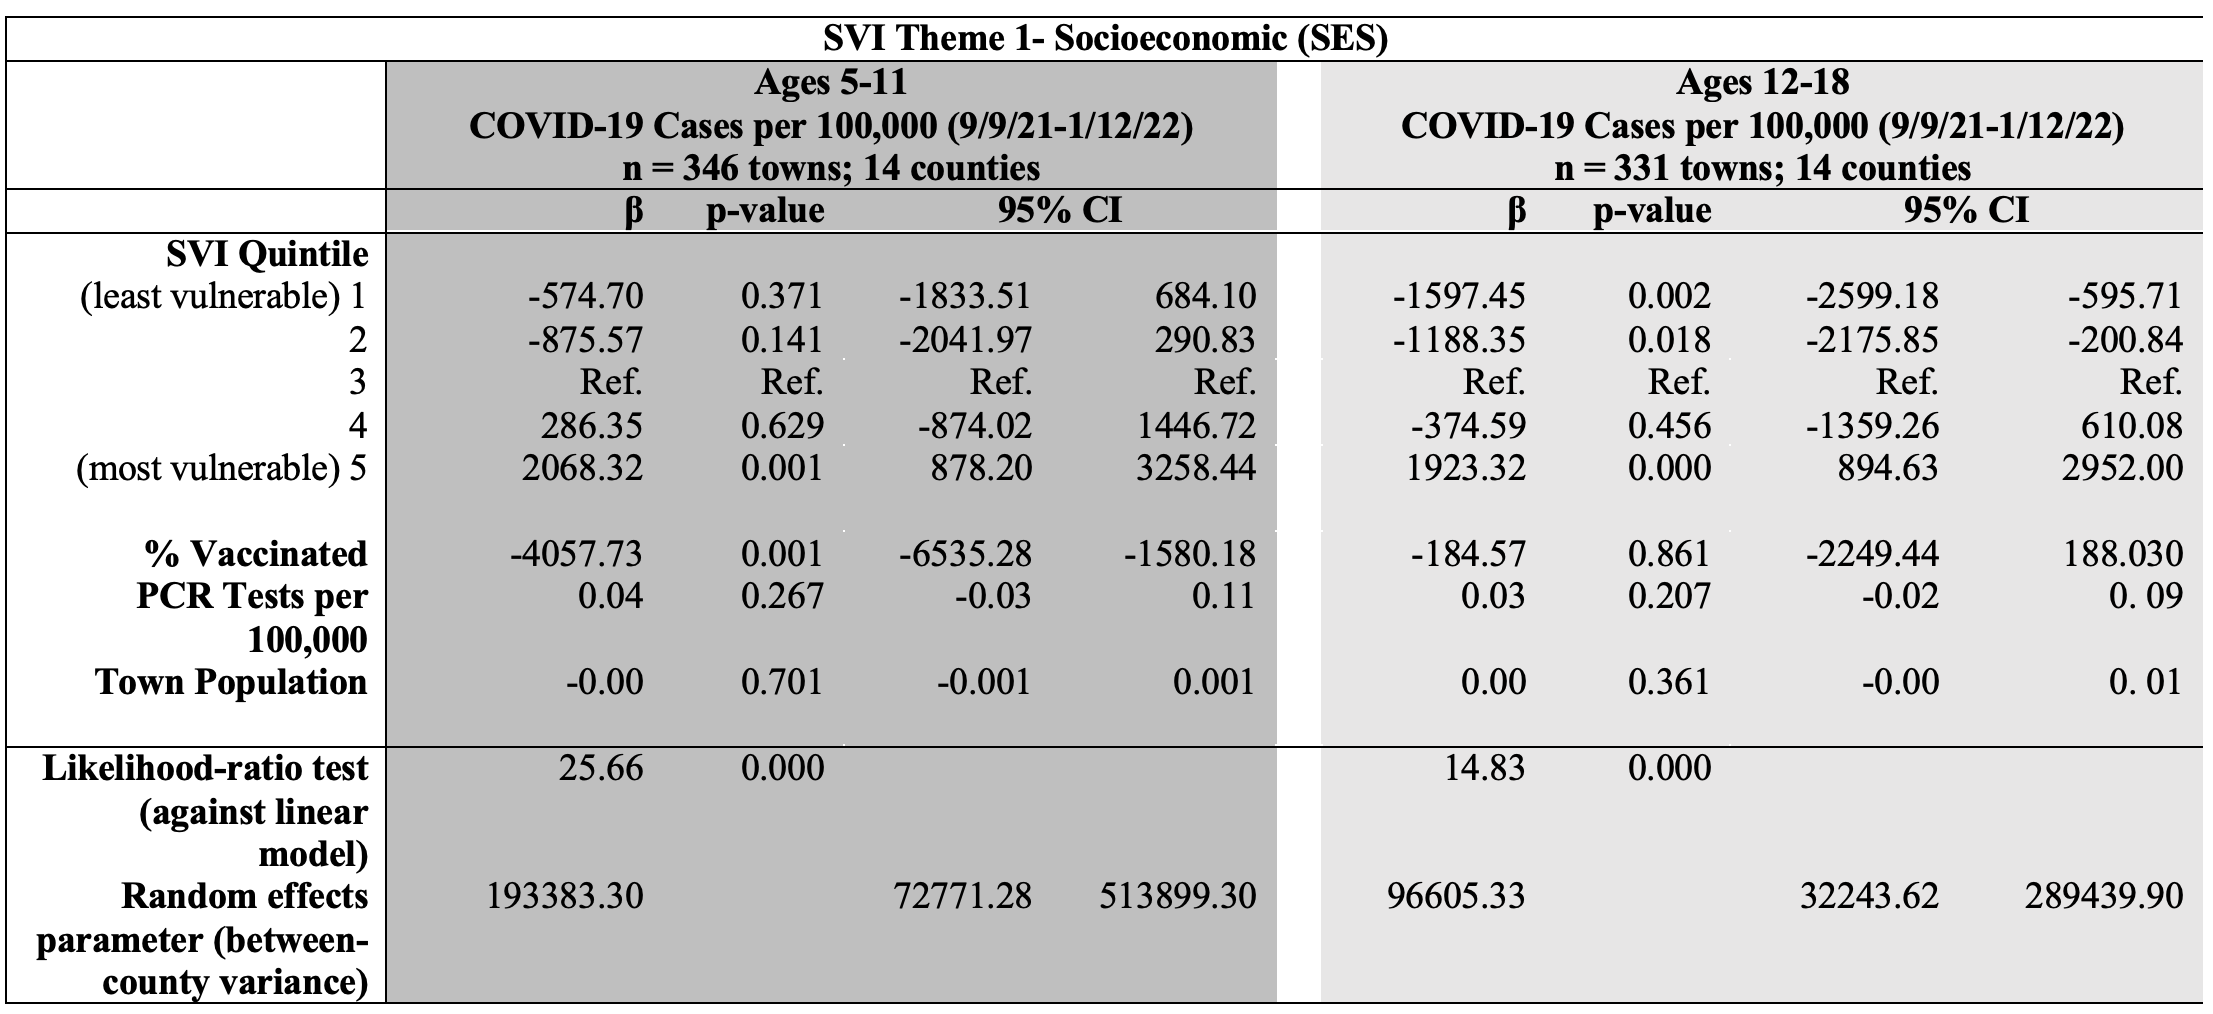
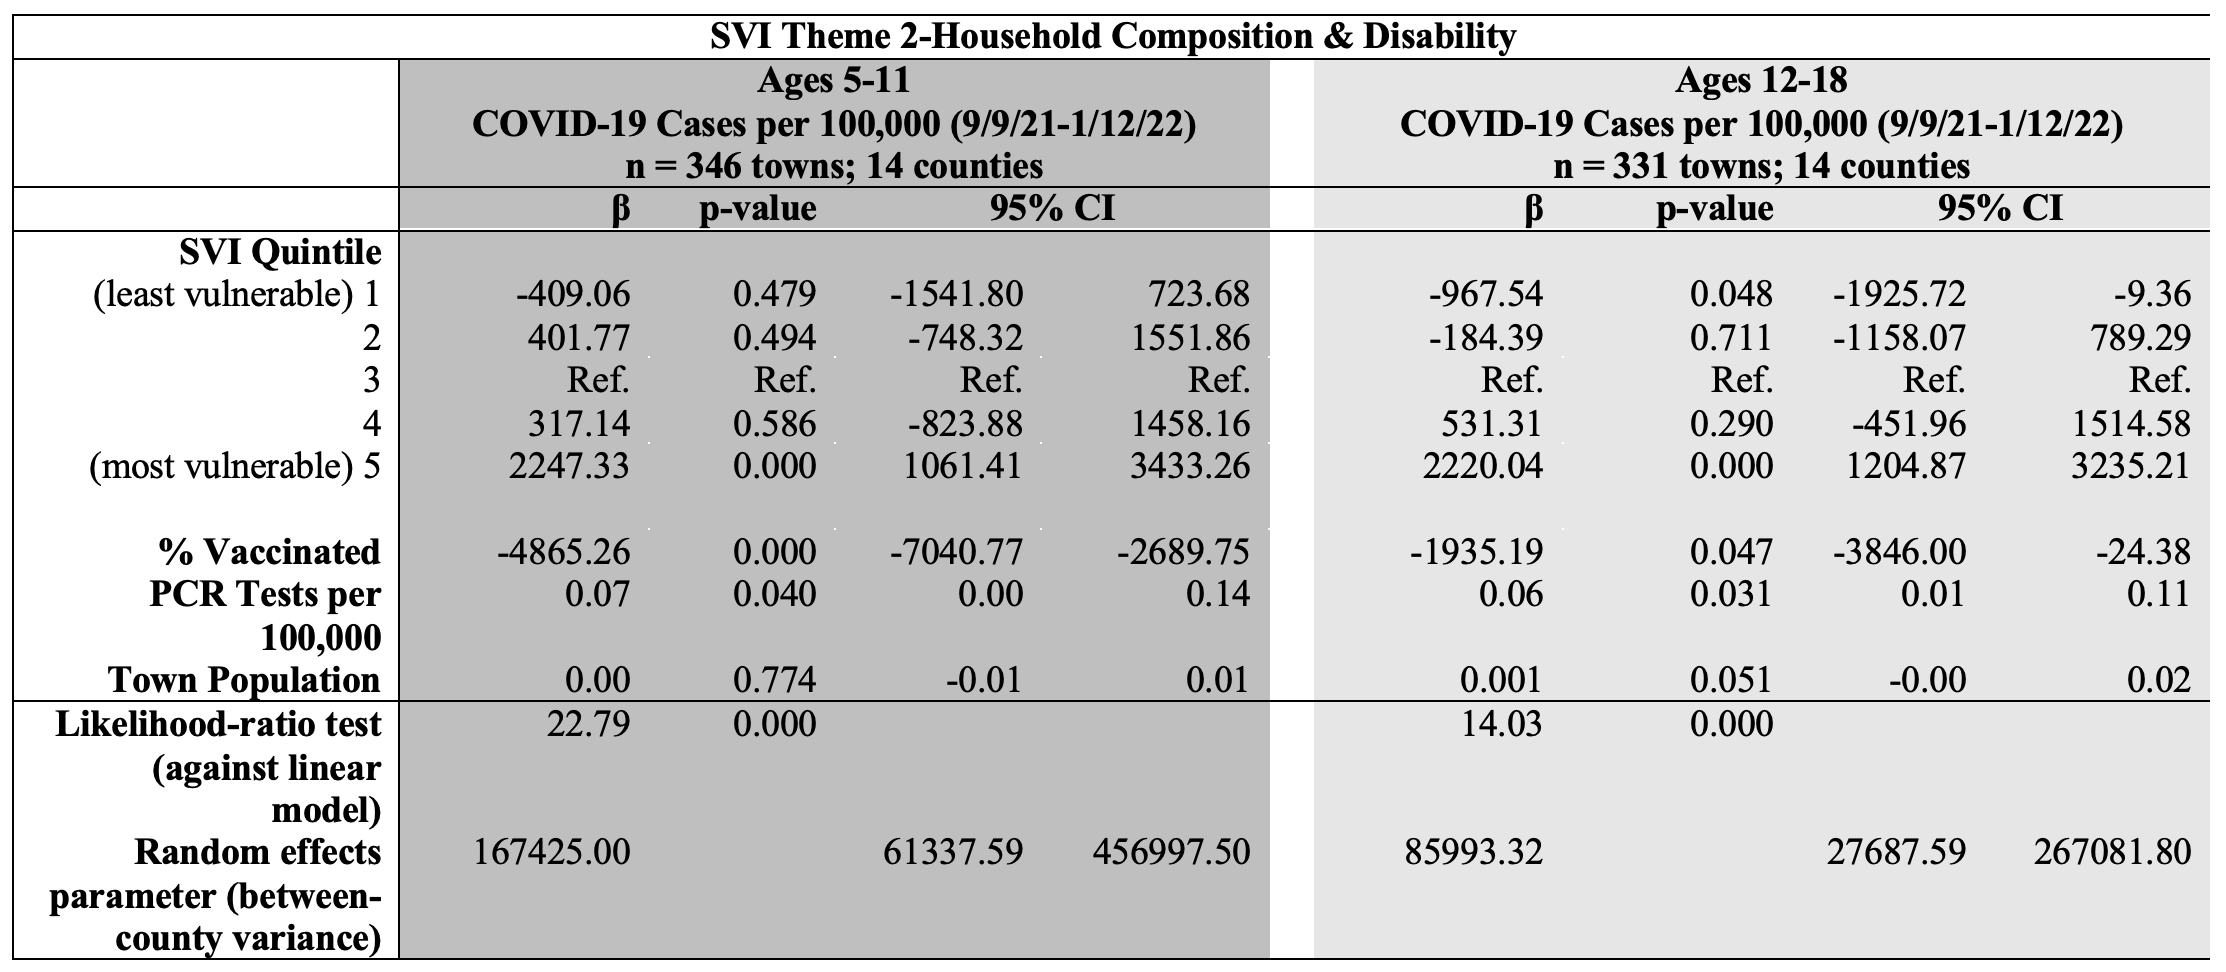
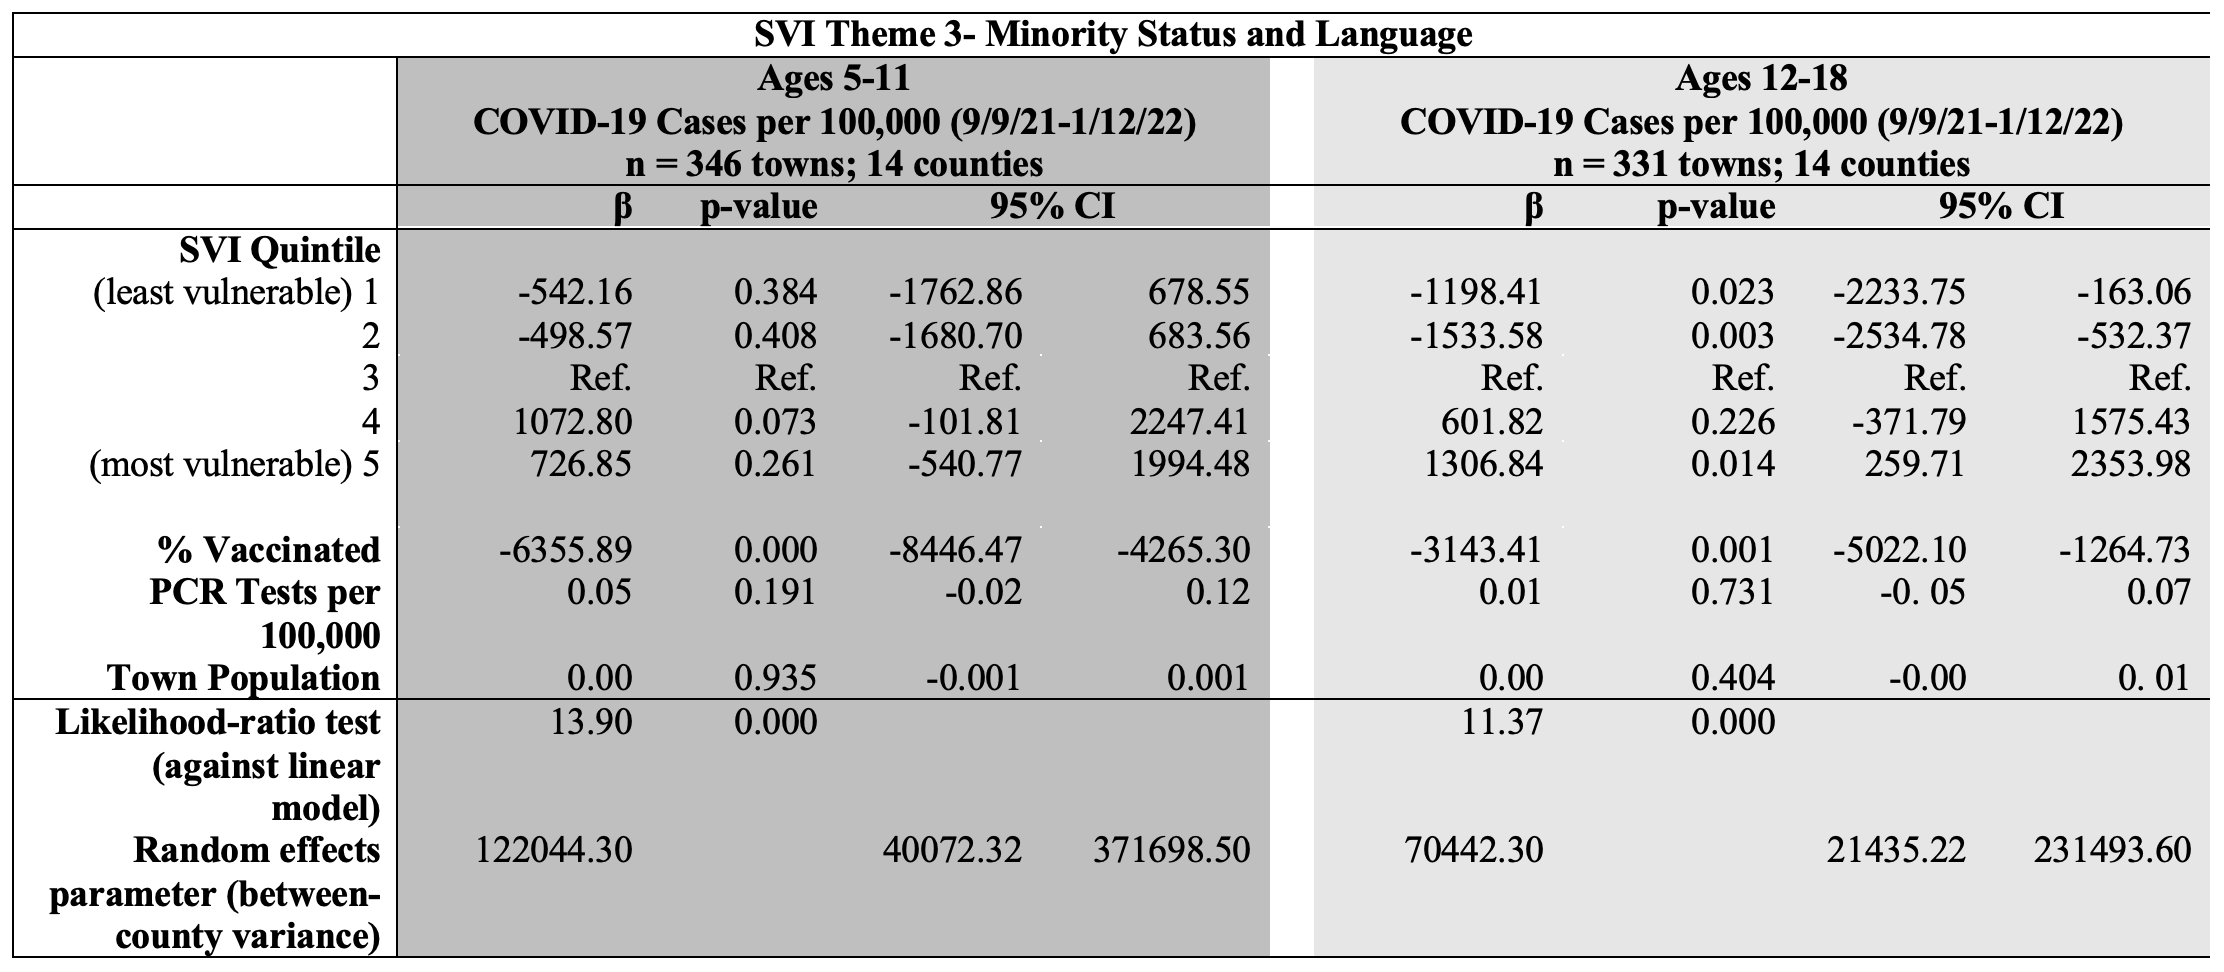
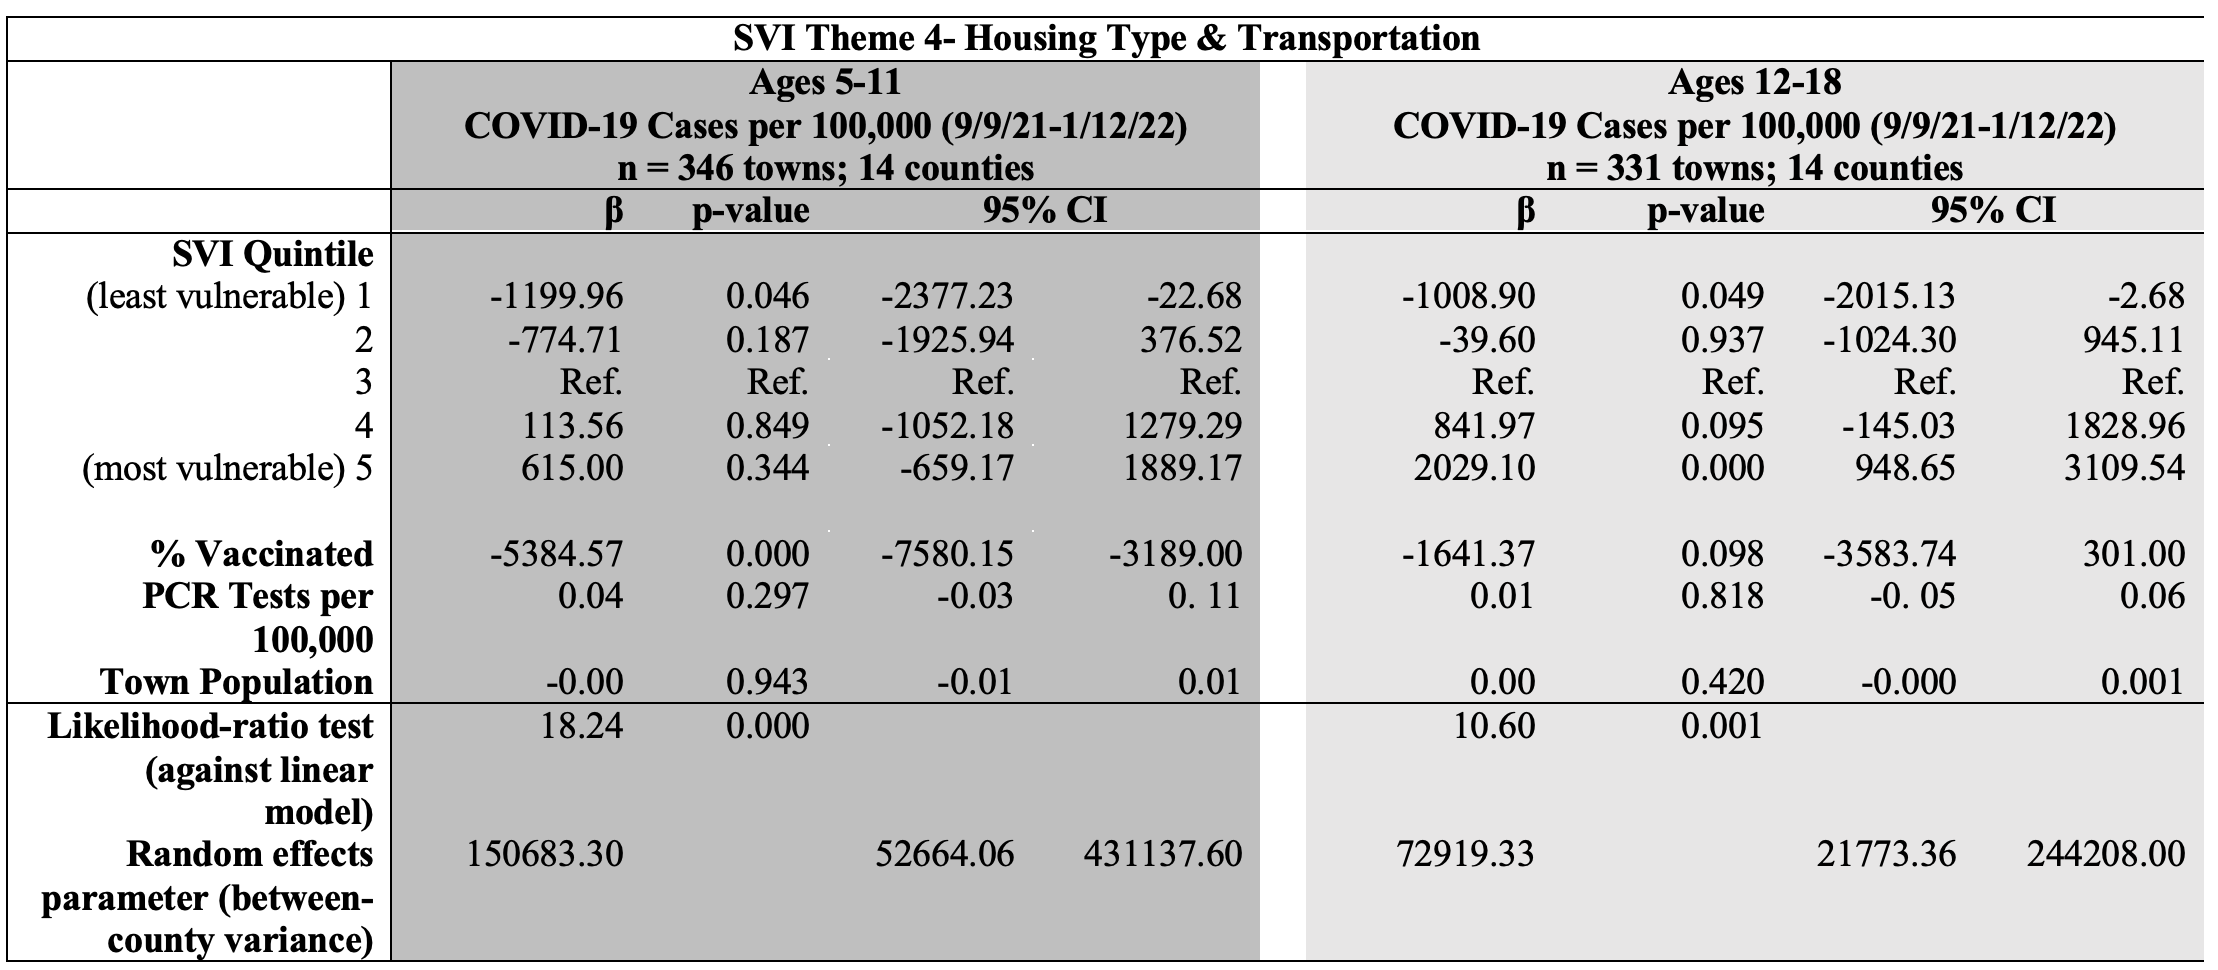
The individual SVI themes’ relationships to COVID-19 case rates are reported in Appendix II. For the age group 5-11, the themes Socioeconomic Status (SES) and Household Composition were associated with a greater number of cases for children living in the fifth SVI quintile relative to being in the third SVI quintile. For the age group 12-18, the SVI themes SES, Household Composition, Minority Status, and Housing Type & Transportation were associated with a greater number of cases for children living in SVI Quintile 5, relative to being in the third SVI quintile.
Obtaining town-specific data with a special focus on children living in vulnerable communities is of great importance. We need to plan for current and future outbreaks of other infectious diseases such as the flu and RSV that profoundly affected school-age children this past winter. Of equal importance, infectious disease experts are concerned about yet unforeseen infectious diseases, with epidemic potential, that must be planned for at the national, state, and local levels. Our findings suggested that COVID-19 was a greater burden on children in the most socially vulnerable towns and underscore the critical need to protect these children from future public health threats.
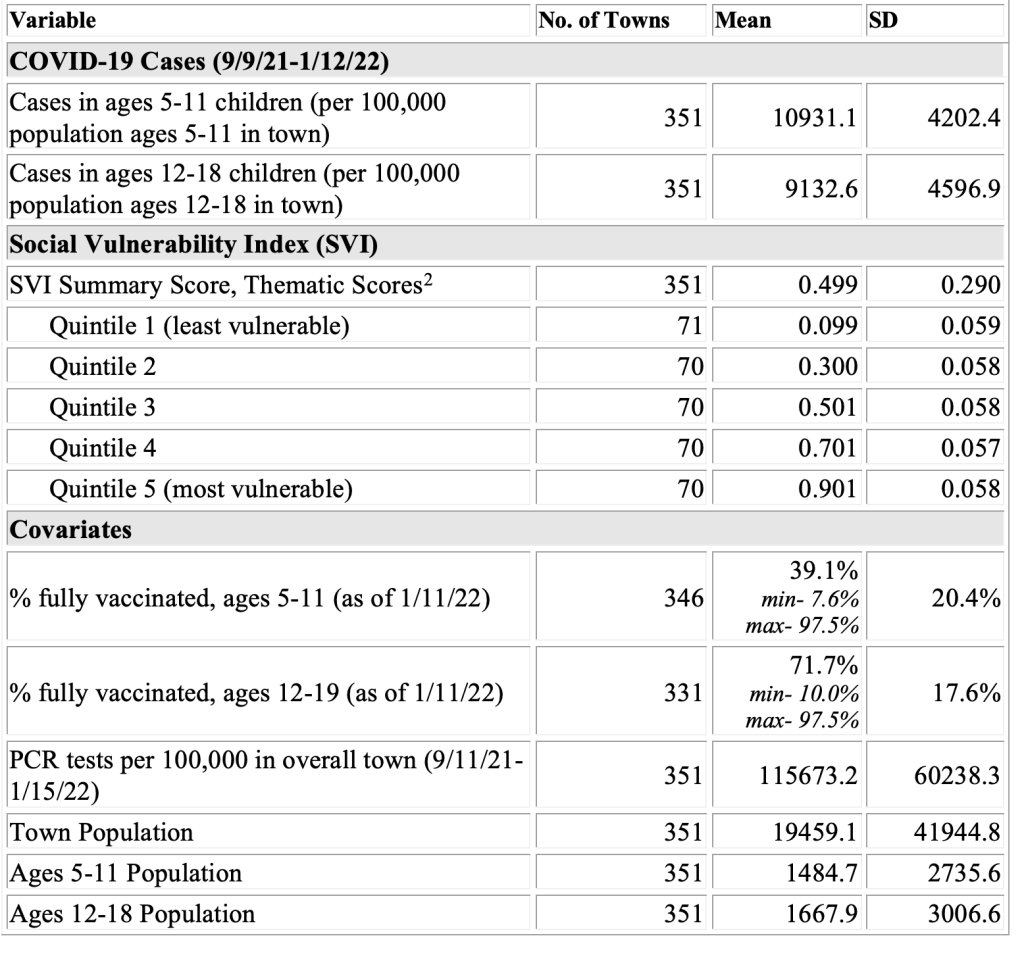
Towns are grouped into 5 equal-sized categories of SVI. Summary statistics are identical for the summary score and scores for Themes 1-4. Theme 1: Socioeconomic; Theme 2: Household Composition & Disability; Theme 3: Minority Status & Language; Theme 4: Housing Type & Transportation.
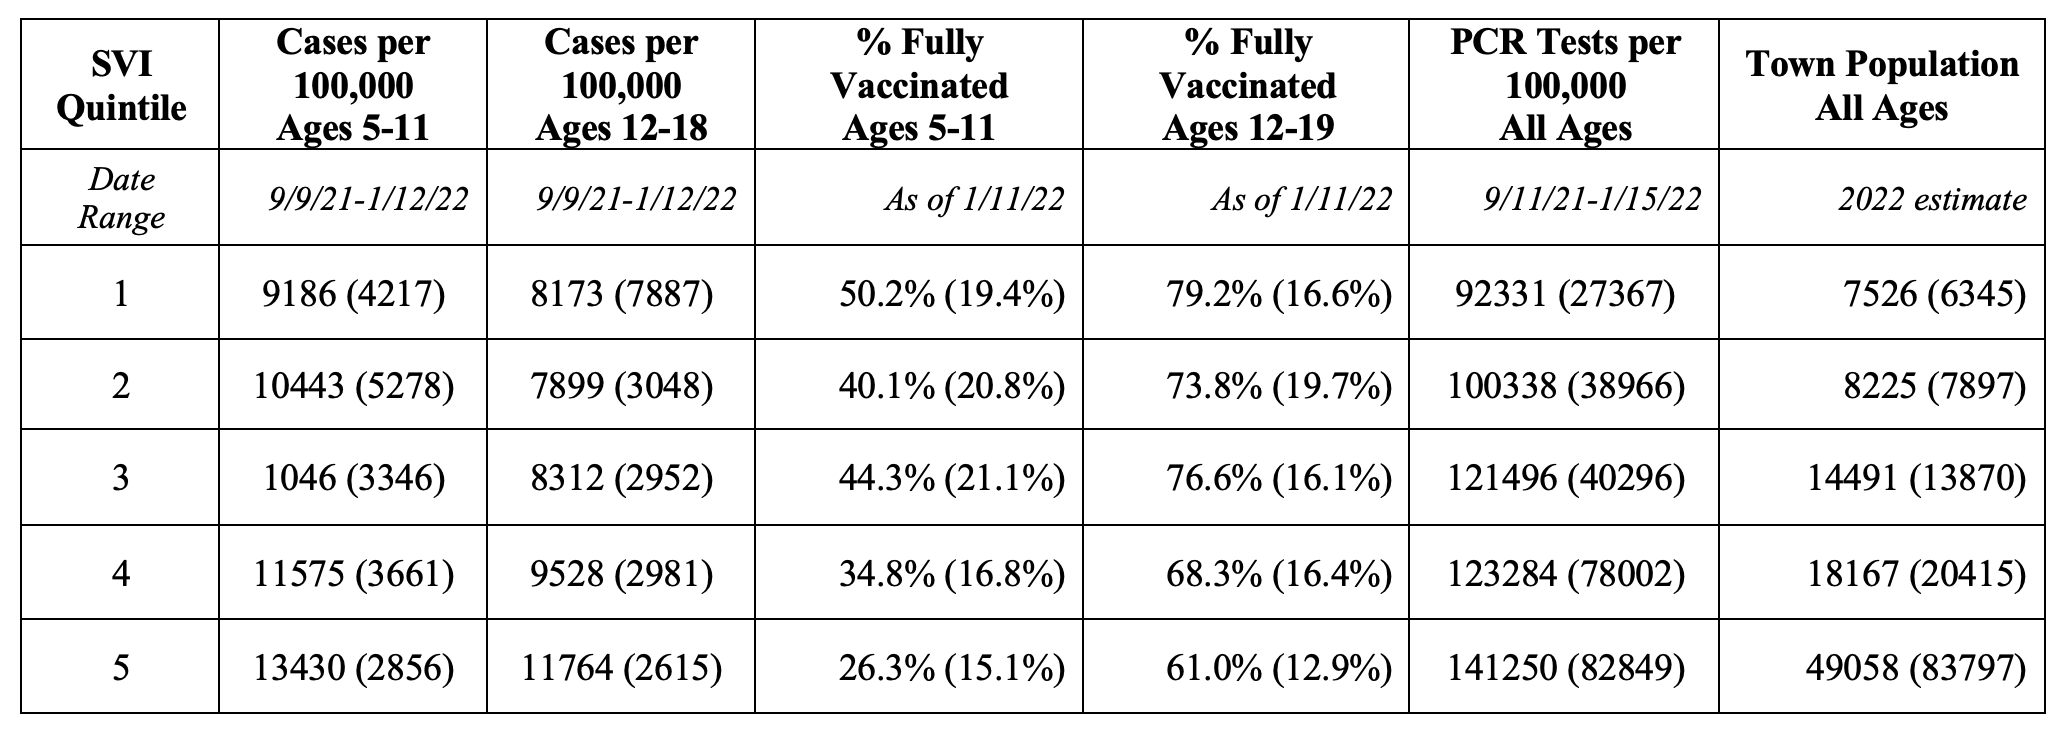
Standard deviation listed in parentheses.
The authors of this study have no relevant financial disclosures or conflicts of interest.
Kaitlin Schroeder is a recent graduate of the Harvard T.H. Chan School of Public Health MPH program, where she studied social determinants of health in disease areas ranging from cancer to COVID-19. She currently works as a project manager in the field of oncology diagnostics.
Kristina Thompson is an Assistant Professor in the Health and Society chair group of Wageningen University & Research, the Netherlands. She is a health demographer and quantitatively studies the social determinants of health. She completed her PhD in the Health Economics group of the Vrije Universiteit Amsterdam.
Manika completed her Master in Public Health at Harvard T.H. Chan as part of the Social and Behavioral Sciences Department in 2022. Manika has since gone on to work as a Director of Population Health, working with underserved geriatric populations to expand access to mental health and substance use interventions in primary care settings. Manika’s interests in research include health equity, health literacy, and social determinants of health.
Dr. Donald R. Miller completed his Doctor of Science in Nutrition and Epidemiology at the Harvard School of Public Health. He currently serves as Research Professor at the University of Massachusetts and as Senior Epidemiologist with the VA Medication Safety Center and, until recently, the Center for Health Outcomes and Implementation Research. His current research and publications focus on population health, emerging epidemics, safety and effectiveness of therapies, and evaluation of patients’ experiences in health care.
Scott Troppy is a Surviellance Epidemiologist at the Massaschusetts Department of Public Health. He has interests in spatial and geographic research. He also works with infectious disease surveillance data for the Commonwealth of Massachusetts. He has a Masters in Public Health from Boston University.
Alan Geller is a Senior Lecturer in the Department of Social and Behavioral Sciences at the Harvard TH Chan School of Public Health. He has a long-standing interest in cancer prevention, early detection of cancer, and a myriad of issues related to children.
BCPHR.org was designed by ComputerAlly.com.
Visit BCPHR‘s publisher, the Boston Congress of Public Health (BCPH).
Email [email protected] for more information.

Click below to make a tax-deductible donation supporting the educational initiatives of the Boston Congress of Public Health, publisher of BCPHR.![]()
© 2025-2026 Boston Congress of Public Health (BCPHR): An Academic, Peer-Reviewed Journal
All Boston Congress of Public Health (BCPH) branding and content, including logos, program and award names, and materials, are the property of BCPH and trademarked as such. BCPHR articles are published under Open Access license CC BY. All BCPHR branding falls under BCPH.
Use of BCPH content requires explicit, written permission.