Gunness H. Communty-level factors associated with COVID-19 morbidity and mortality in Queens, New York City. HPHR. 2021; 29.
DOI:10.54111/0001/cc7
The Coronavirus Disease 2019 (COVID-19) pandemic has had a profound and disproportionate effect on poor and vulnerable communities in Queens, New York. Community-level factors are likely the root causes of these disparities. Using publicly available data, we conducted a descriptive analysis by examining community-level factors among two communities in New York City: a district with the highest rates of COVID-19 cases and a district with the highest rate of COVID-19 deaths. We extracted data on demographics, health status, access to healthcare, socioeconomic conditions, and environmental characteristics on these two communities from public records on June 11, 2020. The community with the highest rate of COVID-19 cases had lower education, limited English proficiency, and severe overcrowding. In contrast, the community with the highest rate of deaths experiences more health disparities, avoidable hospitalizations, and premature deaths. This study adds to the existing literature on COVID-19 affecting vulnerable communities with high incidence and mortality.
According to data from the New York City Department of Health and Mental Hygiene (NYCDOHMH), the city’s poor and vulnerable communities experienced exceedingly high rates of morbidity and mortality due to the Coronavirus (COVID-19) pandemic. As of May 25, 2020, over 196,098 New Yorkers have been infected, resulting in 51,197 hospitalization and 16,482 laboratory-confirmed deaths (NYCDOHMH-COVID-19 data, 2020). While COVID-19 infection rates among the 44 and older age group in NYC were similar, mortality rates were disproportionately higher among men, at 255 per 100,000, as compared to women, at 155 per 100,000. Additionally, mortality rates were higher among people who identify as Latinx, at 230 per 100,000, and Black, at 218 per 100,000 compared to White, 109 per 100,000; and Asian, 102 per 100,000, (NYCDOHMH-COVID-19 data, 2020).
Following the spread of the pandemic, two community districts in Queens, New York have experienced alarming rates of COVID-19 incidence and mortality. District 4, specifically Corona, had the highest rate of COVID-19 infections in the borough, accounting for an average rate of 4,895 cases per 100,000 (NYCDOHMH-COVID-19 data, 2020). As of June 11, 2020, the average mortality rate in the District was 442 per 100,000 (NYCDOHMH-COVID-19 data, 2020). District 14, specifically Far Rockaway, accounted for an average rate of 2,535 cases per 100,000 (NYCDOHMH-COVID-19 data, 2020). Though this is considerably less than District 4; the average mortality rate was 476 per 100,000, the highest in the borough (NYCDOHMH-COVID-19, 2020).
According to the Center for Disease Control and Prevention (CDC), severe illness and deaths due to COVID-19 are caused mainly by underlying medical conditions such as heart disease, lung disease, cancer, diabetes, immunodeficiency, kidney disease, and liver disease (CDC, COVID-19, 2020). It is unclear, however, why District 4 had the greatest rate of COVID-19 cases in the borough, and District 14 had the highest rate of deaths in the same borough. This purpose of this study is to examine and compare underlying community-level factors between these two districts — such as demographics, health status, access to healthcare, socioeconomic conditions, and environmental characteristics.
We conducted a cross-sectional study using descriptive statistics. The data collected were retrieved from NYCDOHMH and aggregated by Community Districts, which encompass multiple towns. In this case, District 4 includes Corona and Elmhurst and District 14 includes Far Rockaway, Arverne, Edgemere, Broad Channel, and Breezy Point. The data was retrieved using zip codes that were matched to each District and then compared to each District.
Districts 4 and 14 were examined using publicly available data extracted from the NYCDOHMH Community Health Profiles and New York University (NYU) Furman Center on June 11, 2020. The data used to develop community health profiles were from a variety of sources such as the NYC Health Department Community Health Survey — an annual, random-digit-dial telephone survey of approximately 10,000 adults conducted each year in New York City — American Community Survey, and NYC Health Department Vital Statistics. Raw data was not available for public consumption; therefore, this study extracted descriptive statistics using proportion estimates on variables such as demographic data (such as age and race), rates of COVID-19 morbidity and mortality, health status, access to healthcare, socio-economic status (such as poverty, unemployment, and education), and environmental conditions.
The following are definitions of each variable that was extracted from NYCDOHMH Community Health Profiles: “Health status” is defined using self-reported health status which asked the question “Would you say that in general your health is excellent, very good, good, fair or poor?” Similarly, obesity, diabetes, and hypertension, were also self-reported using the same survey. The “avoidable hospitalization” rate is defined as residents who are not receiving adequate access to primary healthcare or preventive programs to manage disease conditions. “Psychiatric hospitalizations” are defined as the rate at which residents are hospitalized based on a psychiatric diagnosis, and “premature death” is defined as death before the age of 65. “Access to healthcare was defined as residents’ health insurance status. Poverty, unemployment, and education were used to measure socioeconomic status. “Poverty” is defined as the total pre-tax income for a family that falls below the government threshold, and “unemployment” is defined as not working in the last week (NYCDOHMH-COVID-19, 2020).
The NYU Furman Center had available data on housing units and severe overcrowding both of which were not present in the NYCDOHMH Community Health Profiles. We collected information on environmental characteristics such as housing units, rent burden, and severe overcrowding from the NYU Furman Center, which used data from the American Community Survey (ACS) estimates conducted every five years. Severe overcrowding” is defined as the percentage of renter-occupied homes versus the share of all renter households in which there are more than 1.5 household members for each room in the unit (NYU Furman Center, 2018). “Rent burden” refers to the rent in households where the gross rent (including electricity and heating fuel costs) was equivalent to at least 50% of their income (NYU Furman Center, 2018). “Housing units” refer to the number of housing units as separate living quarters (NYU Furman Center, 2018).
Table 1 displays the public data from the NYCDOHMH and the NYU Furman Center and provides descriptive statistics for Districts 4 and 14 vis-à-vis community-level indicators such as health status, access to healthcare, socioeconomic status, and environmental characteristics.
District 4 is majority Latinx, representing 51% of the population, followed by Asians at 36%, Whites at 6%, and Blacks at 5%. Foreign-born in the community represented 63%. Fifty-one percent of community residents experienced limited English proficiency and 30% of residents reported having less than a high school diploma. In District 14, Blacks represented 40%, Whites 33%, Latinx 22%, and Asian 3%. Foreign-born in the community only represented 26%. Twenty-two percent of residents have less than a high school diploma and only 13% reported having limited English proficiency. Lastly, there were no evident differences in age distribution between the two districts (see Table 1).
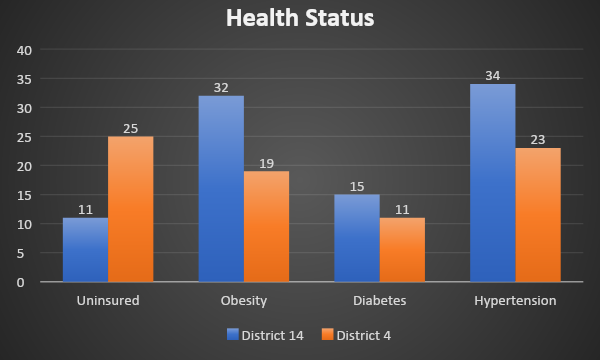
Self-reported physical and mental health status (using responses such as “Good,” “Very Good,” or “Excellent”) was different in District 4 than in District 14 at 68% and 75%, respectively. Avoidable hospitalizations were more prevalent in District 14, with rates of 1,345 per 100,000, than in District 4, with rates of 892 per 100,000. Similarly, significant health disparities were found in the rate of psychiatric hospitalizations in District 14, at 1,158 per 100,000, compared to those of District 4, at 440 per 100,000. Furthermore, there were differences found among pre-existing conditions directly associated with COVID-19 deaths, as shown in Figure 1. For example, about 32% of District 14 inhabitants were found to be obese whereas only 19% were in District 4. District 14 also had a higher occurrence of hypertension (34%) and diabetes (15%) than did District 4 (23% and 11%, respectively).


Other health metrics, however, show greater differences. The premature mortality rate in District 14 (269 per 100,000) was more than twice that in District 4 (105 per 100,000). District 14 also had higher mortality rates due to heart diseases (75 per 100,000 vs. 16 per 100,000) and cancer (57 per 100,000 vs. 35 per 100,000) than District 4. Lastly, the average life expectancy in District 14 was 77 years compared to 86 years in District 4.
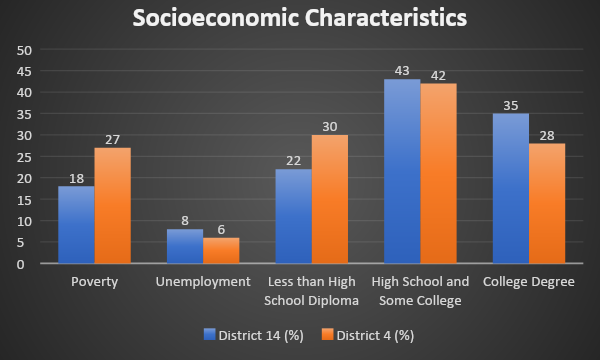
Based on the NYCDOHMH Community District Health Profile, 30% of residents in District 4 have less than a high school diploma, which is almost 30% greater than District 14, as shown in Figure 2. Conversely, District 14 had slightly more college-educated residents than District 4. Regarding poverty, District 4 is 33% more impoverished than District 14. However, the incarceration rate among residents 16 years and older was disproportionately higher in District 14 than District 4, at 824 per 100,000 and 227 per 100,000, respectively.


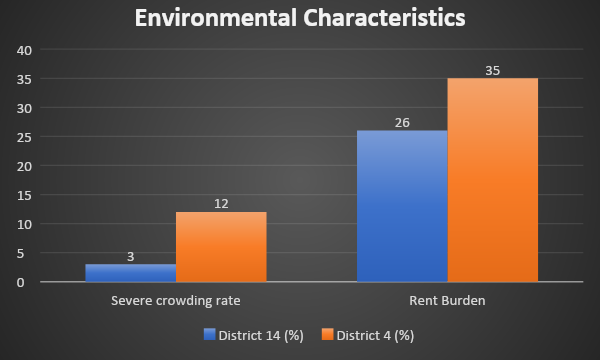
Districts 14 and 4 have a comparable number of housing units, 46,463 and 48,857, respectively. District 4 reported a 12% severe overcrowding rate (based on the five-year American Community Survey estimates) than District 14 (3%), as shown in Figure 3. Furthermore, the rent burden was greater in District 4 than 14 (35% vs. 26%). District 14 lacks healthcare facilities and resources and is considered a medically underserved community after the closing of Peninsula Hospital in 2012 (New York State, Office of the State Comptroller, 2018).


This study used publicly available data to examine factors associated with COVID-19 morbidity and mortality — such as health status, access to healthcare, socioeconomic status, and environmental factors — that put the residents of District 4 and District 14 at heightened risk for COVID-19 incidence and/or mortality. There are distinctive characteristics in each community that make them more susceptible. District 14 residents were primarily U.S.-born, while District 4 residents were heavily foreign-born. Although District 4 residents reported poorer access to healthcare as compared to District 14, the self-reported health status of District 4 residents is significantly better. This finding is consistent with other studies highlighting that immigrant children and adults have better health and lower mortality rates than U.S.-born individuals, even though they have less access to healthcare (Singh et al., 2013).
District 14 had certain characteristics at a community level that may have led to disproportionate deaths due to COVID-19. For instance, the rate of premature mortality in District 14 was two and a half times that of District 4. The mortality rate of heart disease in District 14 was almost five times that found in District 4. Additionally, cancer mortality was almost two times greater in District 14, and life expectancy was approximately ten years shorter in District 14. Regarding existing chronic conditions, obesity and hypertension are also found in higher proportions, suggesting that residents of District 14 are at an increased risk of dying from COVID-19 due to these pre-existing conditions (CDC, 2019; Docherty, 2020). Compounding the issue further, residents of District 14 had almost double the number of avoidable hospitalizations than District 4, meaning that hospitalization may have been avoided had they had adequate access to healthcare.
The disproportionate rate of poor health outcomes found in District 14 suggests a profound lack of access to quality healthcare services. One of the reasons is that the area is deemed a medically underserved community in NYC (NYS Comptroller, 2018). According to Health Resources and Services Administration (HRSA), medically underserved areas are areas or populations that have very limited primary care providers, increased infant mortality, higher poverty, or a larger elderly population (HRSA-MUA FIND, 2020). Other reasons for poor health outcomes in District 14 include long wait times, inconvenient hours, and significant geographic distance, as indicated in a Doctors of the World (2014) report. According to Bilinksi (2020), lack of access to healthcare, poor public health infrastructure (particularly for pandemic preparedness), and pre-existing health conditions (that can easily be treated), seem to be the root cause of COVID-19 mortality in the U.S. which outnumbers other countries in this statistic. Additionally, high COVID-19 mortality rates in the US may also be attributed to the fact that comorbidities exist in a younger population; hence, the reason for the overwhelming mortality rates in District 14 (Chaudhry et al., 2020).
As noted earlier, District 4 had the highest rate of COVID-19 cases in Queens, and the larger New York City area. One distinguishing characteristic of District 4 that separates it from District 14 is the “built environment” which refers to housing conditions and limited affordable housing. According to the NYU Furman Community Health Profile report (2018), District 4 was four times more severely overcrowded than District 14. In 2018, the number of housing units in District 4 was 48,857, only 5% greater than Far Rockaway, 46, 463(NYU Furman Center, 2018). However, District 4 was 39% more populated than District 14, reinforcing its severity of crowding. Studies have found that residents in crowded and poor housing conditions are at a 50% greater risk for COVID-19 infection and at a 42% greater risk for COVID-19 mortality (Ahmad et al., 2020).
The NYU Furman Center study (2018) findings suggest that socioeconomic factors may play a role in the increased risk of infection among District 4 residents. For instance, overcrowding may be due to poverty and the inability to afford rent. This is indicative in District 4, as it had a poverty rate of 27%, compared to 18% in District 14. Even though District 4 had a slightly lower unemployment rate than District 14, it seems likely that the income disparities influence the way people live. The lack of affordable housing and the high cost of living in NYC leave families with no alternative but to share rooms and reside in crowded spaces. There may be other factors associated with poverty that increase District 4 residents’ risk of infection. Gray and Moore (2020) reveal that poor communities, usually of color, may be at heightened risk for COVID-19 infection due to low paying jobs that are considered “essential” workers. These jobs may include grocery store employees, sanitation workers, healthcare workers, and public transportation personnel. Compounding the issue further is that poorer urban communities may rely on public transportation (as opposed to the use of private vehicles), which also increases their risk of getting the COVID-19 infection (Gray and Moore, 2020).
Apart from health status, access to healthcare, socioeconomic, and environmental conditions affecting health outcomes, it is important to highlight the difference in the racial and ethnic composition between the two communities; each with distinct differences in health outcomes. As discussed earlier, District 14 experienced significant mortality due to COVID-19. Blacks represented the largest racial group in District 14 (40%) followed by Whites (33%). Blacks, however, account for substantially more COVID-19 cases than Whites. Blacks reside in areas of the district where there is the most significant number of COVID-19 cases (NYCDOHMH COVID-19, 2020). They were also significantly more concentrated and marginalized in specific areas in District 14, subjecting them to astronomical health disparities (NYU Furman Center, 2018).
District 4, on the other hand, has a different racial composition. There are significantly more Latinx residents in District 4 and, although they have better health outcomes than residents in District 14, their socioeconomic and environmental conditions may heighten their risk for COVID-19 infection. The dense concentration of impoverished foreign-born residents in District 4 seems like the perfect breeding ground for COVID-19. These racial and housing disparities seem consistent with other research. Urbanization (the movement of migrants to urban areas) may have led to substandard housing and unsanitary conditions that put new migrants at increased risk for infectious diseases (Carl-Johan, 2015). Furthermore, Dorn (2020) highlighted that the racial and ethnic inequalities that were existing before the pandemic, are more pronounced as a result of the pandemic.
Our findings in this study highlight the distinct demographic, health status, socioeconomic, and environmental factors in two communities that make them more susceptible to COVID-19 infection (as observed in District 4) or death (as observed in District 14). Severe overcrowding places individuals at heightened risk for COVID-19 infection in District 4. Other factors, including the type of employment, low wages, and access to food, laundry, and other essential supplies, may compound the issue further. On the other hand, disproportionate pre-existing health conditions in District 14 seem to increase residents’ risk for mortality due to COVID-19, despite having health insurance. To that end, this study underscores the underlying community-level factors that are to be considered when planning COVID-19 prevention efforts; specifically severe crowding and low English language proficiency in District 4, and existing health disparities and access to quality healthcare in District 14.
Dr. Harlem J. Gunness is Director of Pharmacy Administration and Public Health at St. John’s University in New York.
BCPHR.org was designed by ComputerAlly.com.
Visit BCPHR‘s publisher, the Boston Congress of Public Health (BCPH).
Email [email protected] for more information.
Click below to make a tax-deductible donation supporting the educational initiatives of the Boston Congress of Public Health, publisher of BCPHR.![]()
© 2025-2026 Boston Congress of Public Health (BCPHR): An Academic, Peer-Reviewed Journal
All Boston Congress of Public Health (BCPH) branding and content, including logos, program and award names, and materials, are the property of BCPH and trademarked as such. BCPHR articles are published under Open Access license CC BY. All BCPHR branding falls under BCPH.
Use of BCPH content requires explicit, written permission.